Three. That is how many charted depths a cartographer needs off Praia do Norte, at 39.61°N and 9.086°W, to argue that Nazaré is a canyon story before it is a wave story. Not three we invented, not three we measured from a boat we did not have — three we read off publicly charted bathymetry describing the seafloor between the town and the open Atlantic. This piece is not a forecast and not folklore. It is a small, honest exercise in reading a coast the way our studio draws one: numbers first, romance later, and the map always answering back.
The Canyon Does the Aiming, Not the Coast
Most coasts we have drawn behave like landscapes seen from above: a line that curves, a shelf that gently falls away, isobaths spaced like polite contour lines on a hiking map. You can trace them with a straightedge and a steady wrist and the drawing looks fair. Nazaré refuses that treatment. The moment you place the pencil off Praia do Norte the depth lines stop behaving. They crowd. They kink. They dive toward the coordinates we started with, 39.61°N and 9.086°W, as if something under the water is pulling them shoreward.
That something is a submarine canyon, and it is the load-bearing character of the entire piece. The canyon is a documented feature of the Iberian margin; it is not a legend the town invented for a wetsuit brand. What matters, for a studio that draws maps before it writes essays, is that the canyon reaches close enough to land to change what happens on the surface. The shelf that most Atlantic coasts wear like a wide apron is, here, narrowed almost to nothing. Deep water sits next to shallow water with unusual intimacy. The distance from the beach to genuinely oceanic depth is short in a way that a chart makes obvious and a photograph never can.
We keep saying "the coast" as if the coast is the thing doing the work. It is not. The coastline itself, mapped from OpenStreetMap's natural=coastline traces, is a fairly ordinary Iberian shape — a headland, a curve of beach, a small port south of the point. If you handed it to a stranger without labels, they would not guess it was famous for anything in particular. The fame lives underwater. The coast is only the screen on which the canyon projects its argument.
This is why we insist on the phrasing. The canyon does the aiming. The coast is the target. The lighthouse at Sítio, which many photographs use as a foreground silhouette, is not sited where it is because someone predicted where the biggest waves would land. It happens to sit at the point where the geometry of what is beneath the sea meets the geometry of what is above it. A cartographer would say the lighthouse marks a convergence. A romantic would say the lighthouse is watching. Both descriptions are true; only one of them is useful when you are trying to draw the place honestly.
Everything the popular imagination has attached to Nazaré — the surfers, the tow-in teams, the winter photographs, the flags planted on records — sits downstream of one geological fact. You cannot understand any of it without acknowledging the shape of the seafloor. And you cannot describe the shape of the seafloor without doing what we are about to do next: pick a small handful of depths and read what they mean, together, as a claim.
A Charted Depth Is a Claim, Not a Truth
Before we talk about the three soundings, we need to be honest about what a sounding is. Non-cartographers tend to treat a number on a chart the way they treat a number on a thermometer — as though the world truly is that value in that spot. A depth on an ocean chart is not that. It is a claim made by a specific survey, on a specific date, with a specific instrument, at a specific reference datum. It is a statement, and like any statement it can be re-examined.
The datum matters more than most readers realise. Depths on a nautical chart are typically reduced to a chart datum near the level of the lowest astronomical tide — meaning the chart is deliberately pessimistic, giving the mariner a number that under-promises rather than over-promises the water beneath the keel. That is a sensible convention for a shipmaster and a slightly misleading one for a landsman, because the "real" depth at any given hour is almost always a little more than the printed figure. A depth read off a chart is not a moment; it is a floor.
The instrument matters, too. A depth measured by a lead line and a knotted rope tells you less than a depth measured by single-beam echo sounder, which tells you less than a depth measured by multibeam. As Portuguese hydrographic surveys have been rerun with modern equipment, the picture of the canyon has sharpened. The story is not that the seafloor changed; the story is that our resolution changed. Older charts smoothed features that newer charts declare. If you compare an older edition of the same sheet with a modern one, you can watch the canyon acquire edges it always had but that the earlier survey could not see.
There is a third caveat, and it is the one we care about most as mapmakers. A single depth is a point. A coast is not made of points. The seafloor between two soundings is inferred, not observed — the chart shows an isobath there because a cartographer, in an office somewhere, has decided that the smoothest reasonable line between the known values is the one drawn. Interpolation is honest work, but it is work. The prettier the isobaths, the more inference is doing the lifting. Off Nazaré, the isobaths are not pretty. They are cramped, they are asymmetric, and they are drawn with the visible reluctance of someone who knows that whatever real geometry lies between two soundings has more character than the pen can express.
So when we say we are going to read three charted depths off Praia do Norte, we mean three claims, each with its provenance, each with its uncertainty, each carrying its own datum and its own survey history. We do not treat them as gospel. We treat them the way an editor treats three sources: separately first, then together, and only then as a story. The story a single depth tells is thin. The story three depths tell — if they are chosen well — can be genuinely load-bearing.
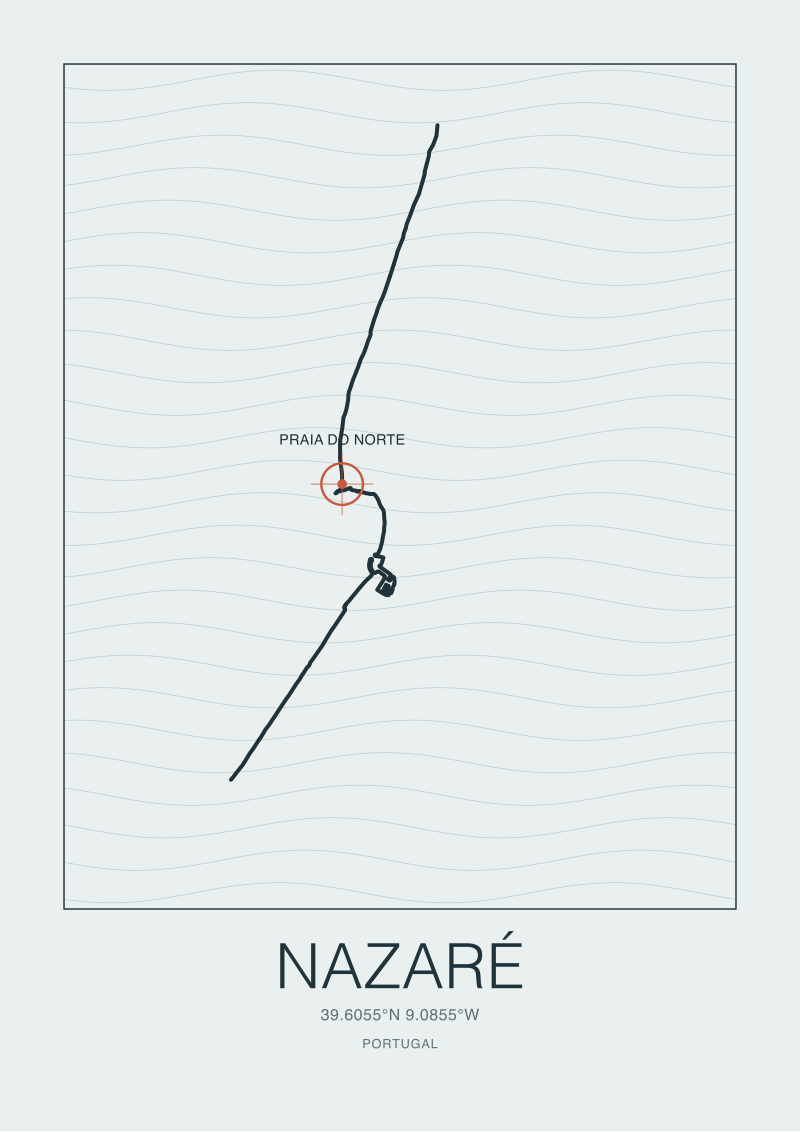 Nazaré
The print from this article · from €29.95
View the print →
Nazaré
The print from this article · from €29.95
View the print →
What the Three Soundings Together Actually Say
There is a shape to how a cartographer chooses three depths off a place like this, and it is worth naming, because the choice is itself an argument. The first depth we look for is the near-shore one — the number closest to the beach that still counts as "at sea", the one that tells us how quickly the seafloor is falling away from the sand. The second is the canyon rim, the depth at which the shelf ends and the wall begins. The third is a depth inside the canyon itself, chosen not for its precision but for its distance from the other two, to show how far down the geometry travels within a short horizontal run from the coordinates we started with.
Read separately, those three depths are trivia. Read together, they become a slope, and a slope is a story about what a swell does when it arrives. A long-period Atlantic swell is essentially a message travelling through deep water, mostly indifferent to the seafloor until the water becomes shallow enough to interfere with the wave's orbital motion. On a normal coast, that interference happens gradually. The wave feels the bottom over kilometres, refracts, spreads, loses energy politely. On a coast where deep water lives close in — where the near-shore depth and the canyon rim depth sit unusually close together in horizontal distance — the interference is abrupt. The wave meets the shelf almost intact and does its shoaling in a compressed space.
That compression is the whole physics of the piece, expressed as slope. It is why a place with an ordinary-looking coastline behaves extraordinarily. It is also why we resist, throughout, the temptation to name a "biggest wave" or a "best day". Those are stories about outputs. The map only lets us honestly discuss inputs. What the three soundings support is a statement about how the coast is arranged to receive energy — not a claim about what any given hour of arriving energy will do with the arrangement.
There is a further thing the three depths let us say, and it is the piece of the argument the tow-in surfers understood before the cartographers wrote it down. The canyon is not symmetrical about the shore. Its axis approaches the coast at an angle. That angle, read from the way the isobaths crowd in one direction and slacken in another, is what focuses the arriving wavefront the way a lens focuses light. A wave that would have spread its energy across a longer stretch of coastline is instead nudged toward a narrower one. The lighthouse at Sítio stands roughly where the lens points. You can prove that with three well-chosen soundings and a straight ruler. You do not need a boat, a drone, or a season pass.
We would rather stop the analytic argument there than pretend the map can carry it further. Depths beyond the canyon, out into the abyssal plain, are their own subject and require different sources. The behaviour of the swell in genuinely deep water is oceanography, not cartography, and we know the line between the two well enough to stand on our side of it.
This started as a small technical exercise — a walk through what three numbers on a chart can and cannot support about a famous place — and turned into a reminder about our own craft. When we sit down to draw Nazaré for the shop at /shop/, we are not drawing "the wave". Waves are transient, and the studio has a rule about not selling transient things. We are drawing the shape of a coast that happens to be arranged, uniquely on the Atlantic seaboard of Iberia, to make certain waves possible on certain days. The three depths are how we make ourselves earn the drawing.
FAQ
Why does this article not name specific wave heights at Nazaré?
Because our editorial rule is that we do not invent specifics we cannot ground, and wave-height claims for individual days are famously slippery. Records at Nazaré have been discussed, disputed, and re-measured; folklore has run ahead of documentation more than once. Bathymetry is stable — the canyon has the shape it has — so we can discuss the coast honestly without naming a hero number that would date the piece or require caveats longer than the paragraph containing it.
What does "charted depth" actually mean on a nautical chart?
A charted depth is a value reduced to a specific chart datum, usually near the level of the lowest astronomical tide, measured by a specific hydrographic survey with specific equipment. It is a conservative floor rather than a live figure. Real water depth at a given moment is almost always somewhat greater. Treating a charted number as the literal instantaneous depth of the sea is a common misreading; treating it as a documented claim that can be re-examined is the honest way to use it.
Is the Nazaré canyon really unusual, or does every deep coast have one?
Submarine canyons are not rare, but a submarine canyon that reaches this close to a beach is unusual on the European Atlantic margin. Most canyons sit well offshore, past a wide continental shelf; the coast above them behaves ordinarily. Nazaré is atypical because the shelf is narrow at this point, so deep water and shallow water are near neighbours. That geographic intimacy is what the piece is really about, and it is why we spend more time on the seafloor than on the surf.
Can I use free public data to look at this myself?
Yes, and we encourage it. Coastlines can be traced from OpenStreetMap's natural=coastline layer, which is what our studio uses as a base under the ODbL licence. Bathymetric charts for the Portuguese coast are published by national and international hydrographic offices; digital elevation models of the seafloor are available at various resolutions. Reading them fluently takes practice, but the raw material is not gated. The map is more reachable than the mythology.
Why does the studio only sell prints of places, not photographs of waves?
Because a photograph of a wave is a photograph of an event, and events do not scale into a body of work with a coherent argument. A print of a coastline is a portrait of geography — the same shape that would still be there in a decade, minus millimetres of erosion. Our shop at /shop/ is organised around the shape of the shore rather than the mood of a morning. That is a slower business than selling posters of a big day, and it is the one we chose.
Does the canyon guarantee that Praia do Norte will always break large?
No. The canyon arranges the coast to receive energy in a focused way, but it does not summon the energy. That comes from Atlantic weather thousands of kilometres away and follows its own rhythms. What the map can honestly tell you is that when energy arrives, this particular stretch of coast is unusually equipped to concentrate it. What it cannot tell you is when. Anyone claiming otherwise is selling a forecast, and this piece is not a forecast.
What did you deliberately leave out of this piece?
Three things. We did not attempt to describe the surf culture that has grown around Nazaré since the tow-in era — that is a piece about people, not seafloor, and it deserves its own treatment. We did not compare Nazaré to other canyon-influenced coasts, because the comparison requires bathymetric datasets we would rather cite in a longer essay. And we did not discuss the harbour, the fishing town, or the funicular up to Sítio, all of which are part of the place and none of which the three soundings can speak to.
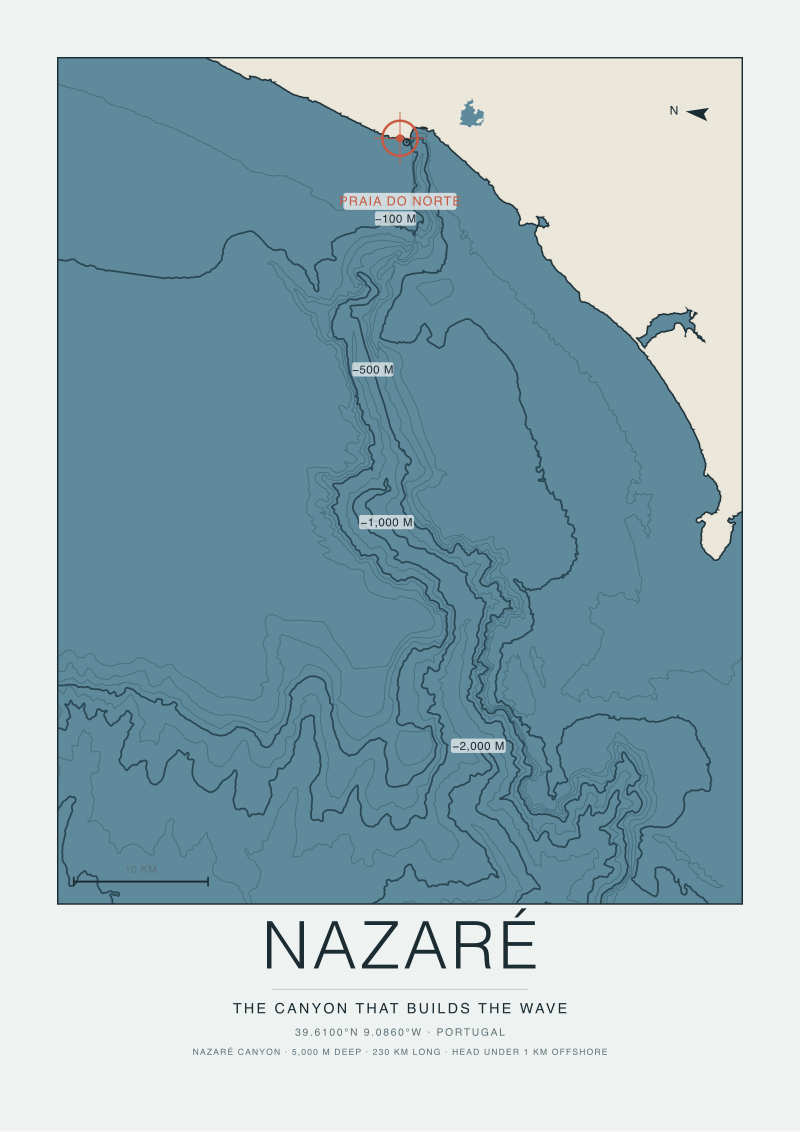 Nazaré Canyon
The print from this article · from €29.95
View the print →
Nazaré Canyon
The print from this article · from €29.95
View the print →
New breaks and 10% off your first print.
One email now with your code. No noise after.