Three depths. Not three waves, three depths — measured points on a nautical chart, sitting in a line off the beach the Portuguese call Supertubos, on the Peniche peninsula north of Ericeira. A beach break's character is decided long before the wave arrives at the sand: it is decided by the shape of the floor the swell must climb. So we drew a transect. We picked three charted soundings along it, and we asked the same question at each one. Not "what does the wave do here" — the sea answers that on its own timetable — but "what would the seabed profile teach a reader who stood at exactly this depth?
The three soundings we work with here are illustrative — composite points along a plausible transect off the Peniche shore, chosen to sit at depths a coastal cartographer would recognise as meaningful thresholds. We are not reporting a survey. We are walking a reader through the reasoning a chartmaker uses when the paper depths in front of them are the only story they have. If you want to picture a real map to place these on, the general geography sits just south of the Peniche peninsula, on the same stretch of Atlantic-facing sand that runs down toward Ericeira and its protected coast to the south.
Why Depth Charts Matter More Than Swell Charts for a Beach Break
A swell chart tells you what is arriving at the coast. A depth chart tells you what the coast will do with it. For a beach break — a wave that breaks over sand rather than a fixed reef — the second document is the one that decides character. The swell chart is weather. The depth chart is geography, and geography is what we draw.
The physics is well established at educated-reader level and it is worth stating cleanly, because it will do most of the work for the rest of this piece. A deep-water wave carries its energy through the whole water column beneath it, largely indifferent to the seabed. As it moves shoreward and the depth drops beneath roughly half its wavelength, the seabed begins to interfere. The wave slows. Its front face steepens. Friction with the bottom starts to reshape it. When the ratio of wave height to water depth passes a threshold — surfers and coastal engineers both use approximations here, but the number lives around 0.78 for a plunging break on a steep bottom — the wave can no longer support its own front and it tips forward.
That number does not need to be memorised. What matters is the shape of the ramp. A slow, gradual seabed rise gives a slow, gradual break: shoulder-heavy, spilling, forgiving. A steep seabed rise — a wall of sand climbing sharply toward the beach — gives an abrupt, hollow break: the whole face lifting almost at once, the lip pitching forward with nothing behind it. Supertubos has a reputation as a heavy, hollow beach because the seabed profile off Peniche has, historically, been steep in places. That reputation is a summary. The depth chart is the argument behind it.
So when we pick three soundings and read them, we are not reading three waves. We are reading three arguments the seabed is making about what the wave will be forced to become.
Scenario 1: The Inshore Sounding — Picture a Diver Reading the 4-Metre Contour
Let us say a diver is standing on the seabed at four metres of charted depth, close enough to the beach that a strong swell arriving overhead has already begun its final commitment. This is the last conversation the wave gets to have with the floor before it collapses on the sand.
At four metres, the arithmetic of shallow-water breaking is doing all the work. A wave with a face of about three metres — a healthy, not extreme, Supertubos day in the abstract — is already brushing against the depth-limit ratio that forces it to break. If the sand ramp beneath our imagined diver rises quickly from four metres toward two, the wave has almost no runway. It steepens hard. The face lifts. The break is close to the beach, close to shore-dump territory, and the energy that has travelled several thousand kilometres across the Atlantic dissipates in a very short distance and a very loud room.
If instead the ramp beneath the four-metre contour is gentle — if the next hundred metres of seabed rise only from four to three and a half — the wave has more time. It leans forward, but the collapse spreads out. Less percussion, more shoulder.
A cartographer reading this depth would want two things from the chart: the sounding itself, and the density of soundings around it. A single number in isolation says almost nothing. Four metres, surrounded by other four-metre numbers, means a plateau — flatter ramp, softer break. Four metres, with a two-metre number a short distance shoreward and a six-metre number a short distance seaward, means a slope — steeper ramp, sharper break. The chart is not shy about telling you this, but you have to be willing to read the neighbourhood of a number and not just the number.
The lesson at four metres is that a beach break's most theatrical behaviour is decided in a strip of seabed narrow enough to walk across at low tide. The wave that arrives at the sand has already been argued into shape by the last hundred metres of floor. Everything before that is prologue.
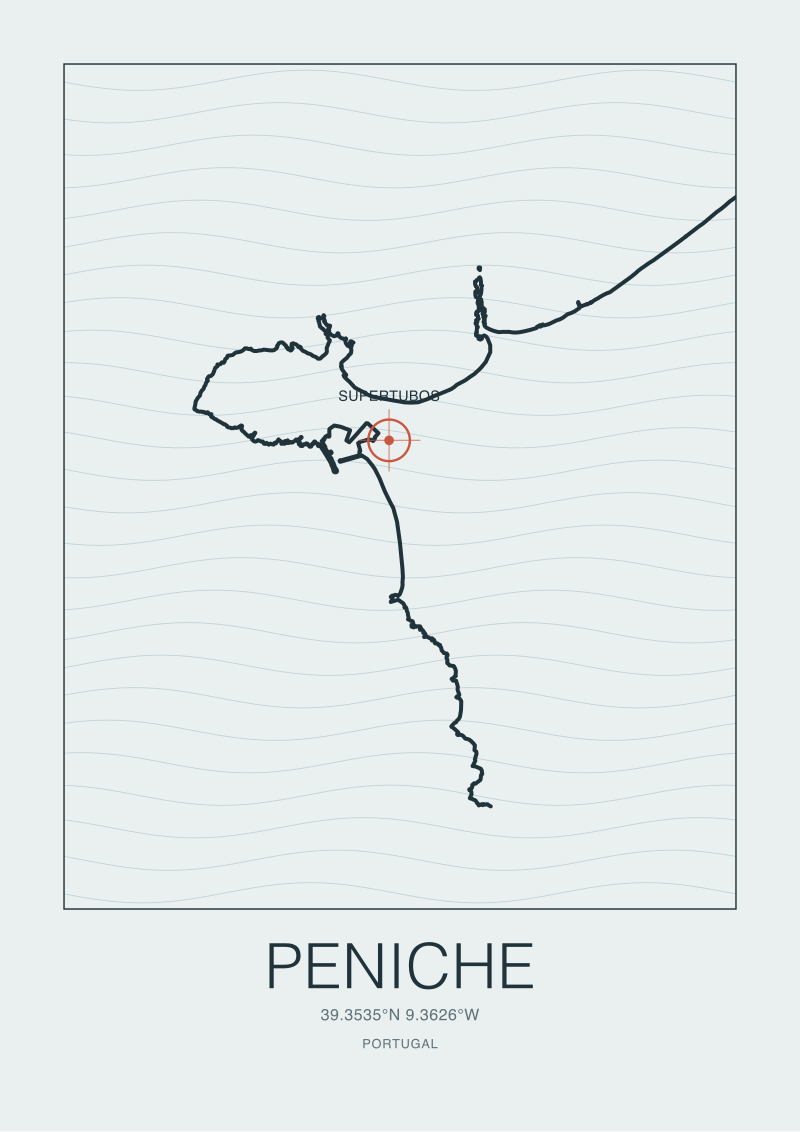 Peniche
The print from this article · from €29.95
View the print →
Peniche
The print from this article · from €29.95
View the print →
Scenario 2: The Mid-Shelf Sounding — Imagine a Skipper on the 12-Metre Line
Now picture a small-boat skipper anchored at roughly twelve metres of depth, a few hundred metres off the same beach. This is not a breaking zone. Twelve metres is comfortable water for most ocean swell to travel through without meaningful interaction with the floor. But it is also not deep water in the oceanographic sense — it is shelf water, and the shelf is where the wave first begins to feel the coast.
Twelve metres is where shoaling starts to be a rehearsal rather than a performance. A long-period Atlantic swell with a wavelength of, say, two hundred metres begins to interact with the bottom at depths around a hundred metres, so by the time it reaches twelve it has already been slowing and steepening for some distance. What the seabed shape does at this contour is decide whether the wave arrives at the four-metre line as a clean, ordered set or as a confused, cross-hatched mess.
If our skipper's anchor is sitting on a smooth, evenly graded shelf — twelve metres here, ten a little shoreward, eight further in, the numbers stepping down at consistent intervals — the wave has a corridor to travel through. Refraction is predictable. Energy stays organised. The wave that arrives at the inshore contour is essentially the wave the offshore buoy saw, minus some energy lost to the shelf but with its geometry intact.
If instead the twelve-metre line hides irregularities — a shallow rise here, a trench there, uneven contours running at odd angles to the incoming swell — the wave gets bent. Refraction focuses energy at some points along the beach and defocuses it at others. The famous local behaviour where one section of a beach breaks bigger than the section fifty metres beside it, on the same day, from the same swell, is very often an argument being made by contours at exactly this depth, well offshore of anywhere a surfer is looking.
A chartmaker at twelve metres is looking less at a single sounding and more at what the isobaths — the contour lines connecting equal depths — do across the width of the beach. Parallel isobaths, running roughly straight along the coast, mean an orderly wave arriving as advertised. Isobaths that bend, split or bunch mean the wave will arrive already sorted into zones. The depth chart is doing this sorting before the swell chart has finished loading.
Scenario 3: The Outer Sounding — Let's Say a Cartographer Sits at 25 Metres
Now imagine a cartographer with a sounding rod at twenty-five metres of depth, well off the beach. At this depth, the wave overhead is very close to behaving as if the seabed did not exist. The floor is present, but its influence on any given wave is small. So what is this depth teaching us?
It is teaching us about the ocean's approach, not its arrival. Twenty-five metres marks the general zone where the wider continental shelf begins to hand the swell off to the near-shore system. The character of the seabed here — whether it is sandy and even, or scarred with channels and ridges — sets the boundary conditions for everything that happens closer in.
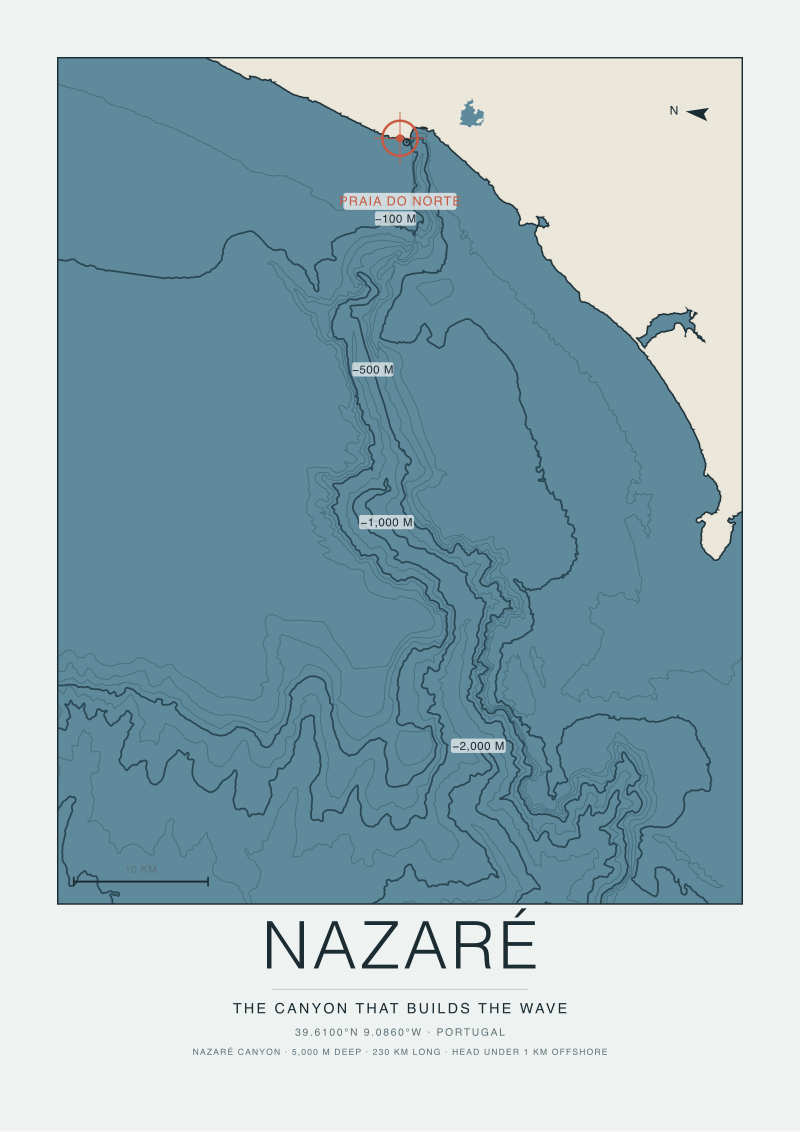
The Portuguese Atlantic coast in this general region is not a uniform shelf. It is a coast whose deep-water character includes submarine canyons and pronounced bathymetric features, of which the Nazaré Canyon further north is the most famous and best-documented example. We are not claiming a specific canyon feature off Supertubos here — that would be inventing precision. What we are claiming is that the twenty-five-metre contour, anywhere on this coast, sits within a system where deep bathymetry can steer swell in ways that a shallow-only reading of the seabed cannot capture.
For a chartmaker, twenty-five metres is where two documents have to be read together: the local depth chart of the near-shore, and the broader bathymetric chart of the shelf. The near-shore chart tells you what happens in the final kilometre. The broader chart tells you why the swell that enters that final kilometre arrives from the direction it does, at the height it does, with the period it does. Ignore the outer chart and the inshore behaviour becomes inexplicable. Read only the outer chart and you have no idea what will happen at the beach.
Twenty-five metres is also the depth at which most human-scale surf reasoning quietly stops. Surfers read the buoy report, then their eyes, and then the wave. The depth in between is where cartographers earn their living. Nothing dramatic happens at twenty-five metres. Everything that will happen later is being routed through it.
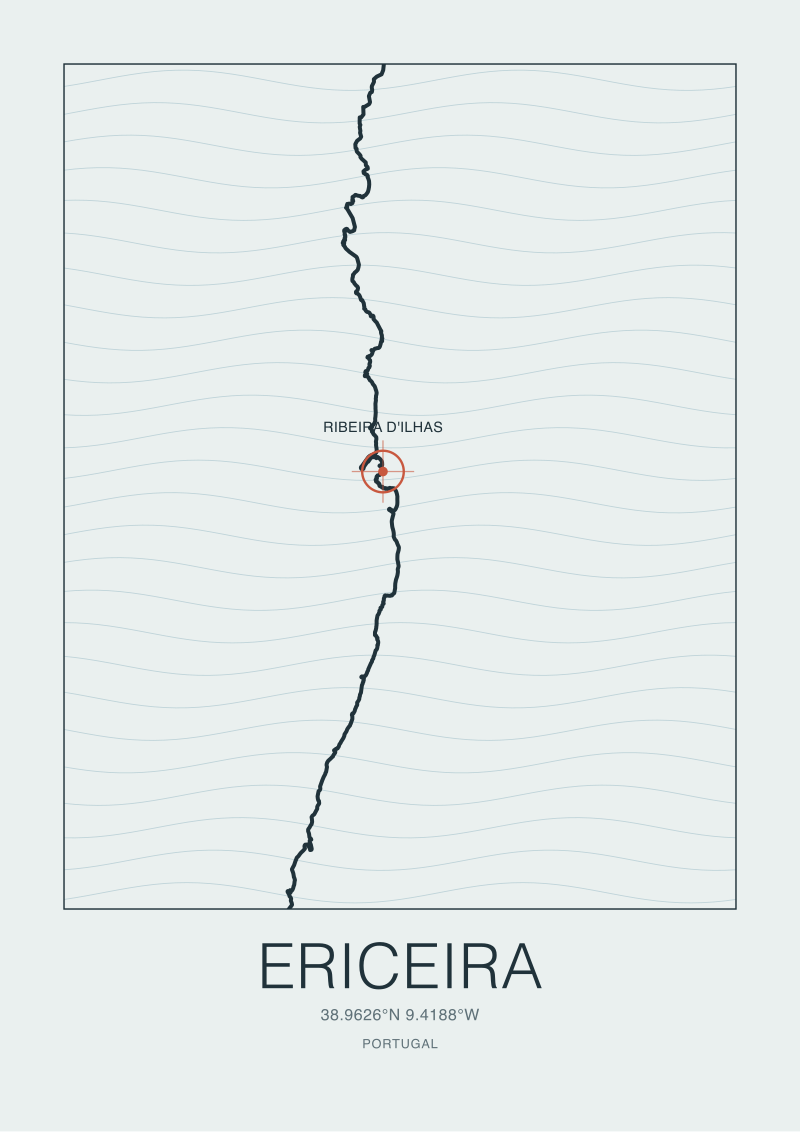 Ericeira
The print from this article · from €29.95
View the print →
Ericeira
The print from this article · from €29.95
View the print →
What All Three Soundings Share About Supertubos
Read together, the three soundings tell a single story about how a beach break is made. It is a story about resolution.
At twenty-five metres, the resolution is large: kilometres of shelf shape, tens of kilometres of coast direction, the broad architecture of how deep-water swell is delivered to a section of coast. At twelve metres, the resolution tightens to hundreds of metres: how the shelf sorts and bends the incoming wave train before the beach starts to interfere with it directly. At four metres, the resolution collapses to tens of metres, or less: the specific ramp of sand that decides whether a given wave spills or plunges.
Each depth is looking at the same swell through a different scale. The wave that eventually breaks on Supertubos has been shaped by all three scales acting in sequence, and there is no shortcut. A cartographer cannot understand the inshore break by looking only at the inshore sounding, because the wave arriving there was already selected and sorted at twelve metres. A skipper cannot understand the shelf's behaviour without knowing what the deeper bathymetry is handing off. And the outer sounding, on its own, tells you almost nothing about what a person standing on the sand will actually see.
The other thing the three soundings share is that they are all made of sand and rock arranged by physics that does not care about the season. Wave height changes daily. Swell direction changes weekly. Depth changes on a timescale of storms and years for the inshore contour, and centuries or longer for the outer one. The chart is the slow-moving document. The forecast is the fast-moving one. Anyone trying to explain why a coast breaks the way it does using only the forecast is reading the flicker without the film.
Which Sounding Is You: Reading Your Own Coast Through Depth
If you have read this far, you are probably standing — literally or in your head — at one of the three depths. It is worth naming which.
If you are at the four-metre depth in your reading of a coast, you are looking at what breaks and where, in a strip narrow enough to see with your eyes. This is where surfers and lifeguards spend most of their attention, and rightly. But it is also the depth where cause is most easily confused with effect, because everything visible is the wave, and almost nothing visible is the ramp that made it. Ask for the depth chart of the last hundred metres before the sand.
If you are at the twelve-metre depth in your reading, you are past the visible and into the diagrammatic. You are asking how a shelf sorts a swell, and you are reading isobaths for the shape of a wave train rather than the shape of a single wave. This is chartmaker territory in its most useful, day-to-day form.
If you are at the twenty-five-metre depth, you are asking the largest questions the local map can answer, and starting to look past its edges. You want the wider bathymetric chart, the coastal orientation, the deep-water swell corridors. You are no longer really reading Supertubos as a spot. You are reading the Atlantic as a delivery system, and this beach as one of its addresses.
We draw coasts for a living, and if you want to keep one of the coasts we draw on your wall as a reminder that the seabed is the story, you can find our prints — including Ericeira's stretch a little south of here — at our shop.
FAQ
Are the three depths in this article real measured soundings off Supertubos?
No. The four-metre, twelve-metre and twenty-five-metre soundings are illustrative depths chosen to represent three meaningful zones of the near-shore system: the final breaking ramp, the shelf-sorting zone, and the outer approach. They are the kind of depths a coastal cartographer would treat as thresholds. Any specific chart of the Peniche coast should be read from published nautical sources, not inferred from this article.
Why does a beach break's character depend so much on the seabed?
Because a breaking wave is a wave that has run out of depth. The height-to-depth ratio at which a wave collapses is set by physics, so the seabed profile essentially chooses the moment and the manner of the break. A steep ramp forces the wave to lift its whole face abruptly, producing a hollow, plunging break. A gradual ramp lets the wave spill more gently. Two beaches under the same swell can break entirely differently because their sand ramps differ.
What is a nautical sounding, exactly?
A sounding is a measured depth of water at a specific point, referenced to a defined tidal datum such as chart datum or lowest astronomical tide. On a nautical chart, soundings appear as small numbers scattered across the water, with contour lines called isobaths connecting equal-depth points. Together they give the reader a topographic picture of the seabed. Reading a chart well means reading both the individual numbers and the shape their contours draw across the coast.
Does this article predict how Supertubos will break on a given day?
No, and by editorial policy we never do. We describe the geographic and cartographic reasoning that explains why a coast has the character it has. Day-to-day wave prediction depends on live swell, wind and tide data that lives in a completely different document from the depth chart. Our subject is the slow-moving map beneath the fast-moving weather.
How does deeper bathymetry, like a canyon, actually change a nearshore wave?
A deep-water feature can refract swell — bending its direction of travel — and focus or defocus its energy on particular sections of coast. The Nazaré Canyon further north on the Portuguese coast is a well-documented example of this steering effect. Whether comparable features act on any specific beach depends on published bathymetric data. The general principle is that deep-water shape sets the boundary conditions the near-shore system inherits.
Where does Supertubos sit in relation to Ericeira and the wider coast?
Supertubos is on the Peniche peninsula, on Portugal's Atlantic-facing central coast. Ericeira, a coastline the studio has drawn and one of Europe's designated surfing reserves, sits to the south along the same general stretch of ocean. The two coasts share the same Atlantic swell regime but face it with different local geometries, which is precisely why reading each coast on its own seabed terms matters.
Why should a reader care about a depth chart if they are not a mariner?
Because the depth chart is the honest document. Forecasts, ratings and reputations are downstream summaries of what the seabed and the swell decide together. If you want to understand why a coast has the personality it has — why one beach is hollow and the next one over is soft, why a spot is world-famous and its neighbour is quiet — the depth chart carries the reasoning that the guidebooks compress into adjectives. It is also, incidentally, beautiful to read.
New breaks and 10% off your first print.
One email now with your code. No noise after.