Thirteen charted depths off Sagres will not tell you where the wave will break tomorrow, and anyone selling that reading is selling a forecast dressed as cartography. What thirteen soundings can do — if the chart is recent, if the transect is honest, if the reader knows the difference between a depth and a slope — is describe the shape of the shore at 37.0058°N, 8.9478°W, where the Tonel headland turns the Atlantic into something with a grammar. This piece is a flowchart in prose. We will ask you three questions. Your answers route you to what the seabed off Sagres is actually worth reading for.
Question 1: Are You Reading Bathymetry as Geography, or as Forecast?
This is the fork that decides whether the rest of the questions matter. A depth reading is a geographic fact — the seabed is at some level below chart datum at a specific point, on a specific bearing, on the day a survey vessel steamed over it and pinged a return. That reading tells us about the shape of a place. It does not, on its own, tell us what a wave arriving from the southwest will do next Tuesday. Confusing the two is the single most common error we see in coastal writing about the western Algarve.
If Yes — you are reading it as geography
Then thirteen depths off Sagres are a small but honest sample of the shelf that fronts the Tonel headland. You are treating them the way a cartographer treats a contour: as evidence of a surface, not as a prophecy. Under this reading, the interesting question is not "how big" but "how shaped." Does the shelf drop away steeply or step down in terraces? Does the transect cross a channel or ride a ridge? Those are questions a chart can answer. Keep going.
If No — you are reading it as forecast
Then you are asking the seabed to predict tomorrow. It cannot. Bathymetry sets the stage on which swells refract, but the swell itself — its period, its direction, the wind at the surface, the tide at the moment of arrival — is what performs on that stage. There are entire fields (SWAN modelling, spectral wave prediction) that combine bathymetry with atmospheric inputs to produce forecasts. A depth column pulled off a chart is not one of them. Stop here, or start over from Question 1 with different intent. The rest of the walkthrough will not save the reading.
Question 2: Does the Chart You're Holding Predate the Last Hydrographic Survey?
Charts age. The seabed does not, at human timescales, off a headland like Sagres — the rock underneath is Mesozoic and the sediment cover moves in a bounded way — but the *chart* ages, because surveying technology has changed. A depth acquired by lead-line in the 19th century, a depth acquired by single-beam sonar in the 1970s, and a depth acquired by multibeam sonar in the 2010s are three different kinds of claim. They should not be compared as if they were the same measurement.
If Yes — your chart is older than the last survey
Then the thirteen depths you are looking at may not reflect what the seabed off Tonel would look like if a modern vessel steamed the same track today. The rock is stable, but the sampling density is not. Old charts sample sparsely; the reason coastal cartographers are still working the same coasts is precisely that modern surveys reveal features — small canyons, ridges, sand-wave fields — that older charts smoothed away. If your thirteen depths came from a chart older than the most recent regional hydrographic survey, treat them as suggestive of the shelf's general slope, not as a description of specific relief. Do not compare them, seabed-feature by seabed-feature, against a modern chart of anywhere else. That is a category error, not an analysis.
If No — your chart is current
Then you have a fair sample. Thirteen depths is still thirteen, which is few, but at least you are comparing a modern reading to something. Now the question is whether those thirteen are arranged in a way that lets them describe anything. That is the next fork.
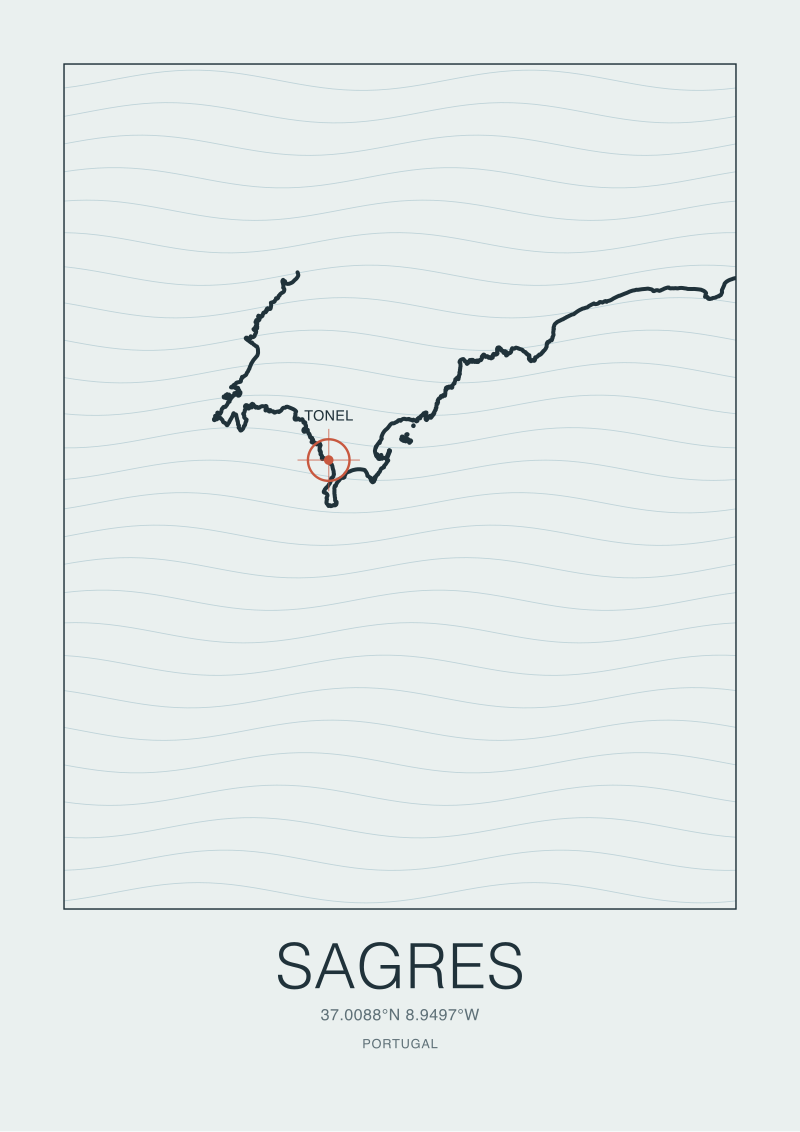 Sagres
The print from this article · from €29.95
View the print →
Sagres
The print from this article · from €29.95
View the print →
Question 3: Are the 13 Depths Sampled Along One Transect, or Scattered Across the Headland?
This is the question most seabed comparisons quietly refuse to answer, because the honest answer often undermines the comparison. Thirteen depths arranged in a line across a shelf — a transect — describe a slope. Thirteen depths scattered across a headland describe an average. Those are almost entirely different kinds of information, and the reader who does not ask which they are looking at will believe they have understood a place when they have not.
If Yes — the depths are a single transect
Then you have the beginnings of a seabed profile. You can plot them and see whether the shelf off Tonel drops away smoothly, steps down, plateaus, or reverses briefly into a ridge. That profile is genuinely useful geographic information — the sort of thing you would draw before framing a coast print, because the shape of the seabed and the shape of the shoreline are the same conversation seen from two sides. Under this branch, the reading is honest and the comparison to other headlands (Cabo de São Vicente to the south, Cabo Sardão to the north) is at least well-defined: you would compare transect to transect, not average to average.
If No — the depths are scattered
Then you have a point cloud, and calling it a "seabed profile" is a euphemism. Thirteen scattered points off a headland the size of Sagres will not describe any consistent feature — not a canyon, not a sand-bar, not a shelf edge. They will average out into a number that is probably close to the mean shelf depth in the survey area and that means almost nothing about the specific ground the Tonel swell is riding when it reaches shore. If this is your dataset, the honest move is to stop describing it as a profile and start describing it as coverage. Coverage is a fine word. Profile, in this case, is not.
If You Answered Everything: The Decision Table
Read the row that matches your three answers. The recommendation is what a cartography desk would actually do with that combination of inputs, before publishing anything about the seabed off Sagres.
| Q1: Geography? | Q2: Chart current? | Q3: Single transect? | Recommendation |
|---|---|---|---|
| Yes | Yes | Yes | Plot the profile, compare to other transects at São Vicente, name the shelf feature explicitly. |
| Yes | Yes | No | Report the depths as coverage of the shelf area; do not draw a profile line. |
| Yes | No | Yes | Treat the transect as suggestive; flag the survey vintage before any inter-headland comparison. |
| Yes | No | No | The dataset supports a general slope estimate only; write about the shelf, not about features. |
| No | Yes | Yes | Wrong tool for the question you are asking — bathymetry is not forecast. Stop. |
| No | Yes | No | Same. Stop. |
| No | No | Yes | Same. Stop. |
| No | No | No | Same. Stop. |
Four of the eight rows end in "stop," which is roughly the proportion of seabed-comparison articles that should not have been written. The four that survive are the ones where the reader has agreed to treat a chart as geography, has checked the chart's age, and has asked whether the sample describes a line or a cloud. Those are the readings worth doing.
What the Sagres Seabed Actually Is, Before You Compare Anything
Before any comparison — thirteen depths, thirty, or three hundred — a reader owes the place a short description of what the shelf off Sagres actually is. Not what a chart might invent about it, but what the geography commits to.
Sagres sits at the southwestern corner of continental Europe, on a limestone plateau that terminates abruptly at cliffs. The Tonel headland is one of the notches carved into that plateau's western edge. To the north, the coast runs up toward Cabo Sardão and the Alentejo; to the south, it turns east past Cabo de São Vicente toward the Algarve proper. The shelf that fronts this corner is neither a broad, gently sloping continental shelf like the Bay of Biscay's, nor a knife-edge drop like the shelves off certain Atlantic islands. It is, in the honest description, a shelf that narrows as it turns the corner from the west coast to the south coast, with sediment cover that varies over short distances because the currents that turn that corner are themselves complicated.
That is what any thirteen depths are a small sample of. A reader who begins with that geography — plateau, notch, narrowing shelf, corner currents — will read a depth column as one line in a much larger conversation. A reader who begins with the column and works backward will produce the kind of article the western Algarve does not need.
We draw the coastlines before we write about them. The line of the Tonel headland at 37.0058°N, 8.9478°W is not, by itself, the story. The story is that the line turns, and that everything under the water turns with it — sometimes visibly, sometimes only in the way waves refract when they arrive from a bearing the corner was not built to receive.
Signals to Watch Before Trusting the Next Depth Comparison
You will read more seabed-profile pieces about Sagres, and about the western Algarve in general. Most of them will be one of the "stop" rows in the table above, dressed up. These are the specific, observable signals that let you tell the honest ones from the rest, without needing to be a hydrographer yourself.
Watch four things.
First, watch whether the piece names the survey. A depth without a survey attribution — vessel, year, method — is a claim without a receipt. Modern Portuguese hydrographic data is produced by the Instituto Hidrográfico; older data has clearer provenance the older it gets. If the piece cannot say where the numbers came from, the numbers cannot do the work the piece is asking of them.
Second, watch whether the piece distinguishes between transect and coverage. This is the Question 3 tell. Any article that plots "thirteen depths" as a line without telling you the depths were sampled along a line has done something that looks like analysis but is not.
Third, watch whether the piece compares like with like. A profile off Tonel compared against another western-Algarve profile is a fair comparison. A profile off Tonel compared against a scatter of depths off Nazaré — where a submarine canyon changes the entire physical problem — is a category error. The moment a piece jumps geographic scales without acknowledging it, you are reading marketing.
Fourth, watch whether the piece resists the forecast frame. If depth numbers are being marshalled to tell you what a wave will do next weekend, the numbers are being asked to work above their pay grade. Bathymetry is one input to wave prediction, not the prediction itself. A cartography desk that respects the difference will say so; a content farm will not.
Those four signals will separate the pieces worth reading from the ones that borrowed a chart to sound authoritative. Thirteen depths off Sagres, honestly read, are enough to describe a shelf. Read the other way, they are enough to mislead a whole coastline.
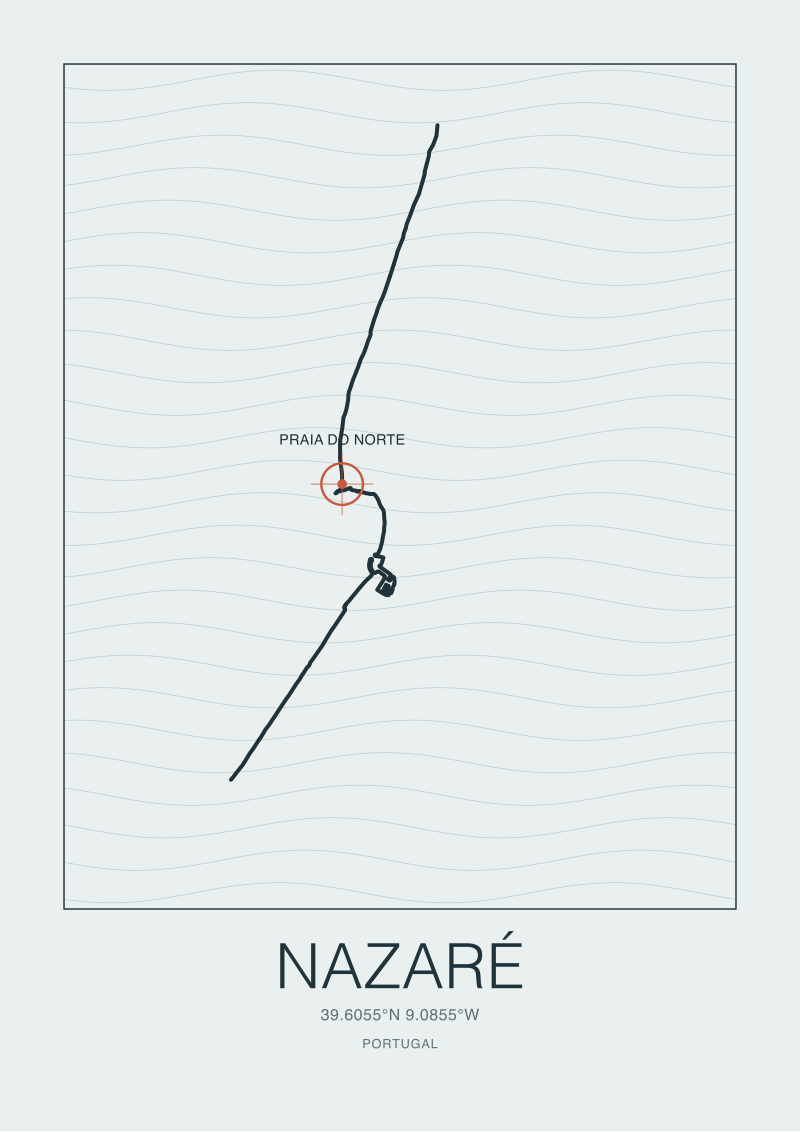 Nazaré
The print from this article · from €29.95
View the print →
Nazaré
The print from this article · from €29.95
View the print →
New breaks and 10% off your first print.
One email now with your code. No noise after.