There is a pattern we keep seeing when readers send us bathymetric screenshots of Mundaka and ask which depth "makes" the wave. They line up thirteen soundings pulled from a nautical chart off the Urdaibai rivermouth, sort them shallow to deep, and expect the shallowest number to be the answer. It is not. The Mundaka left, on the north coast of Spain at roughly 43.407° N, 2.699° W, is not built by a single depth. It is built by the argument between a river-fed sandbar and the shelf behind it, and the chart only tells you that story if you read the numbers as a coastline rather than a ranking.
The Pattern in the Soundings: Why Depth Numbers Get Misread
Every time someone sends us a depth comparison from Mundaka, the request arrives in the same shape. Thirteen soundings, ranked shallowest to deepest, with the assumption that the smallest number is doing the heaviest work. It is a very map-literate instinct and a very wrong one. A nautical chart is not a leaderboard. It is a survey of a surface that behaves like a landscape, and landscapes are not read by picking the lowest point on the page.
The confusion comes from the way charts are drawn for their intended audience. Bathymetric soundings exist so that a boat does not hit the bottom. That purpose privileges the shallowest reading in any given cell, because the shallowest reading is the one that matters to a keel. A surfer, or a studio drawing a coast, is asking a different question entirely: not "where is the bottom closest" but "what is the shape the bottom is drawing." Those two questions produce almost opposite readings of the same numbers.
The second habit that trips people up is treating soundings as points rather than as a field. Thirteen depths off Mundaka are thirteen samples of a continuous surface — the seafloor does not jump between them, it curves. When you sort those thirteen values from shallow to deep and read them as a list, you flatten the field into a ranking and lose exactly the information that explains the wave: the gradient, the direction of the slope, the position of the shallow points relative to the incoming swell. A wave does not feel a number. It feels a rate of change.
We say this often to readers used to reading depth as depth: at Mundaka in particular, the interesting soundings are almost never the shallowest ones. They are the ones that sit just outside the sandbar, at the depth where a long-period swell first starts to feel the bottom and begins to bend. Those numbers are unremarkable in a ranked table. They are decisive on a chart.
The Rivermouth Bar Is the Chart's Loudest Signal
The single loudest thing a depth comparison off Mundaka is trying to tell you is not any individual number. It is the presence and shape of the sandbar at the mouth of the Urdaibai estuary. If your thirteen soundings include a run of shallow readings that sit in a curved line arcing out from the western side of the rivermouth and then dropping quickly on the seaward side, you are not looking at "a shallow spot." You are looking at the bar itself, mapped as a series of samples across its crest.
The mechanics behind that shape are worth stating plainly. A river carries sediment down its valley and into the sea; the sea pushes back with tide and swell; the negotiation between them deposits sand in a specific place and a specific shape. At Mundaka, the Urdaibai estuary drains into a coastline oriented roughly east-northeast to west-southwest, and the sandbar that results sits in the pocket where the westerly-quadrant groundswell from the Bay of Biscay first encounters the bathymetric obstruction the river has built. That is the whole physical premise of the left. It is not a reef. It is a piece of coastal geography that the river maintains and the swell interrogates every winter.
This is why the bar's soundings tend to be the ones that dominate a ranked list without being the ones that dominate the wave. A cluster of shallow readings in a curved arc will always sort to the top of a table. But what matters for the break is not that the crest of the bar is, say, shallower than the surrounding shelf. What matters is *how quickly* it becomes shallow. A bar that ramps up sharply from six metres to two over a short horizontal distance will refract and steepen a long-period swell far more aggressively than a bar that reaches the same minimum depth via a gentler slope over three times the distance.
A depth number is a noun; a depth gradient is a verb, and waves respond to verbs.
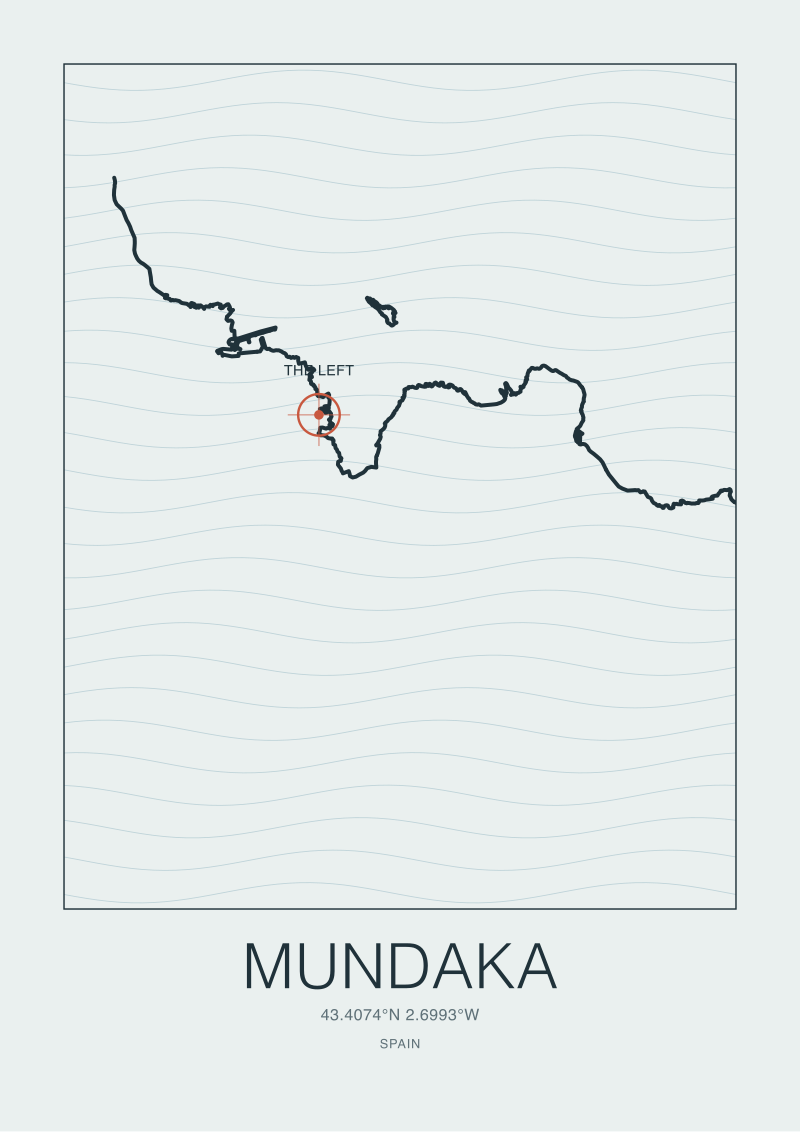 Mundaka
The print from this article · from €29.95
View the print →
Mundaka
The print from this article · from €29.95
View the print →
The Shelf Approach Explains the Shape, Not the Size
If the bar is the loudest signal on a Mundaka depth comparison, the shelf approach is the quietest one, and it is the one that most readers miss entirely. The Biscay coast in this stretch is not a cliff dropping straight into deep water. The seafloor steps down through a series of shelf terraces before reaching the truly deep continental margin, and the way those middle depths — the ones that look boring on a ranked list, the tens of metres nobody screenshots — are arranged determines the shape a swell arrives in before it ever reaches the sandbar.
Wave refraction is the mechanism at work here, and it is worth being precise about what refraction is. When a wave crosses a boundary between deeper and shallower water, the part of the wave in shallower water slows down while the part in deeper water keeps its speed. The wave crest bends toward the shallower ground. Over a long approach across a gently shelving bottom, that bending accumulates. By the time a groundswell reaches the sandbar at Mundaka, it has already been shaped — its crest realigned, its energy focused or spread — by tens of kilometres of shelf it never touched hard enough to break on.
This is why comparing thirteen depths without paying attention to the ones that seem geographically distant from the break is a category error. Those middle-shelf numbers do not "make" the wave in the sense the shallowest sounding does. They aim it. They decide the angle at which the swell hits the bar, and the angle at which the swell hits the bar is what turns a heaving closeout into a rideable left. The chart is trying to show you a two-stage process: a long slow rearrangement out on the shelf, then a rapid transformation over the bar itself, and the two stages read as very different kinds of numbers on the same page.
We stress this to readers who arrive with the shallowest-wins instinct, because it explains a repeated observation. The bar does not always work when it looks like it should. The direction of the incoming swell, mediated by the shelf, decides whether the bar receives the energy from an angle that lines the wave up along its length or from one that jams the wave into the shore all at once. Two winter days can have almost identical swell heights offshore and produce almost opposite results on the sandbar, and the difference lives in the middle depths that nobody thought to compare.
What the Depth Comparison Cannot Tell You
The last thing worth saying about thirteen charted depths off Mundaka is what they cannot do, no matter how carefully you read them. A bathymetric chart is a snapshot of a bottom that is not static. The sandbar at the Urdaibai rivermouth is a river-maintained feature, and rivers rework their deposits on timescales that a nautical chart cannot resolve. Charts are surveyed and revised on institutional cadences measured in years. The bar moves on cadences measured in seasons, sometimes in single storms.
This is not a small caveat. The recent history of the Mundaka bar is a matter of record: dredging in the estuary in the early 2000s altered sediment supply enough that the wave changed noticeably for a period, and its recovery was a slow accounting of sand returning to the shape the river and the sea had previously negotiated. Anything a chart tells you about the bar is a version of the bar at the moment of the survey. The thirteen depths you are comparing may not be the thirteen depths a wave is actually reading this winter. Treat the numbers as evidence about the *kind* of feature the bar is, not as a live measurement of the feature today.
The chart also cannot tell you about tide, and tide at Mundaka is not decorative. The Bay of Biscay carries a meaningful tidal range, and the effective depth over any given sounding rises and falls with it. A crest at two metres on the chart is not a crest at two metres in the water; it is a crest at two-plus-tide, and tide adds or subtracts a substantial fraction of the depth the bar is presenting to the swell at any given hour. A depth comparison that ignores tide is comparing thirteen abstractions, not thirteen conditions.
Finally, the chart cannot show you the argument. The reason the Mundaka left has held cultural weight on the Basque coast for as long as it has is that it is a specific and rare piece of coastal negotiation — a river of a certain size, meeting a coast of a certain orientation, receiving swell from a basin of a certain fetch, all producing a bar that sits in the exact geometry that turns Biscay energy into a long tapered left. Thirteen depth readings can describe the products of that negotiation. They cannot narrate it. That work belongs to the coastline itself, which is why we spend our days drawing it before writing about it. And when we draw Mundaka, the line we are most careful with is not the shoreline. It is the contour of the bar just outside it — the shape the river argues into the sea, sounded thirteen times and always insufficient to a chart.
FAQ
Why is the shallowest depth on a Mundaka chart not the most important one for the wave?
The shallowest sounding tells you where the bar peaks, but a wave does not respond to the minimum depth in isolation — it responds to how sharply the bottom rises toward that minimum. Two bars with the same crest depth will produce very different waves if one ramps up quickly and the other slopes up gradually. On a ranked list of thirteen depths the shallowest number always looks decisive; on a chart, the gradient around it is the actual signal.
What role does the Urdaibai estuary play in the sandbar at Mundaka?
The Urdaibai is the river that feeds the rivermouth at Mundaka, and its sediment is the material the sandbar is built from. The bar exists because the river deposits sand at its mouth and the sea reshapes that deposit with tide and swell. Without the river's ongoing sediment supply, the bar would erode into a shape the swell could not use the same way. The wave is, in a very literal sense, a product of the river's daily negotiation with the coast.
Does a nautical chart show what the sandbar looks like today?
Not reliably. Nautical charts are surveyed and updated on institutional timescales, and the bar at Mundaka reworks itself on the timescale of storms and seasons. The chart tells you the character of the feature — where it sits, what shape it tends toward, roughly how it steps down into deeper water — but the exact contour on any given winter's day is beyond what the chart can promise. Read it as evidence of the kind of bar this is, not the measurement of the bar this week.
Why does the wider continental shelf matter for a wave that breaks so close to shore?
Because a long-period swell begins to feel the bottom and bend long before it reaches the sandbar. The shelf terraces off the Basque coast refract the swell — bending its crest, focusing or spreading its energy — over kilometres of approach. By the time the wave reaches the bar, it is already aimed and already shaped. The bar finishes the transformation, but the shelf decides what kind of wave arrived to be finished.
How much does tide change the effective depth over the bar?
Enough to matter. The Bay of Biscay has a meaningful tidal range, so any depth printed on a chart is a datum — usually a reference low — and the actual depth in the water is that number plus the tide of the hour. On a bar where a shift of a metre changes how a wave feels the bottom, the tide is not a footnote. A depth comparison that does not correct for tide is comparing abstractions rather than conditions the swell is actually meeting.
Did dredging in the estuary really change the wave?
The record indicates that dredging work in the Urdaibai altered sediment supply enough that the character of the bar changed for a period, and the wave changed with it. The bar's recovery was a slow accounting of sand returning to the geometry the river and sea had previously settled on. It is the clearest historical demonstration that the wave is not a fixed feature of the coast but a maintained one, dependent on the river continuing to supply material in the volumes it always has.
Can I use depth soundings to predict when the wave will be good?
No, and this is where a lot of chart-first thinking goes wrong. Soundings describe the bottom. Whether the wave "works" on a given day depends on the swell direction, period, and size, plus tide and wind, all interacting with that bottom. The chart is a permanent document about a place; conditions are a temporary document about a moment. The chart explains why the wave is possible, not when it will happen.
Is the Mundaka left a reef break or a beach break?
Neither category fits cleanly. Mundaka is a rivermouth sandbar — a break sustained by fluvial sediment deposited into a marine environment. It behaves more consistently than a typical beach break because the river keeps rebuilding the bar in roughly the same place, but it lacks the fixed geology of a true reef. The most accurate way to describe it is as a rivermouth left, a category the Basque coast happens to hold in unusually pure form.
New breaks and 10% off your first print.
One email now with your code. No noise after.