Most people checking surf swell open an app, read a number in feet or metres, and treat it as the answer. That number is the wrong end of the question. Hear me out. A swell reading is a global-model output — the number does not know whether the seafloor 400 metres offshore of your break is a canyon, a shelf, or a sandbar mid-migration. The same 1.8-metre reading refracts one way at Ericeira's Ribeira d'Ilhas (38.9885°N, -9.4197°W) and another entirely at Hossegor's La Gravière (43.6713°N, -1.442°W). We draw coastlines for a living. This is the order of operations we use before the app ever opens.
What follows is a flowchart in prose form. Three questions, in this order. Answer them honestly and the app number becomes the last piece of information you consult, not the first.
Question 1: Do You Know the Shape of the Coast You Are Actually Reading?
This is the question almost every surf-check skips. Swell forecasts publish two numbers that matter — significant wave height and peak period — measured at a virtual buoy sitting in open ocean, sometimes tens of kilometres from the shore you care about. Between that buoy and the sand, the wave crosses a seafloor that either amplifies it, disperses it, or bends it sideways. If you do not know the shape of that seafloor, the app is telling you the price of a car before you have looked at the car.
The tool we use for this is a bathymetric chart — a map of the seabed rather than the surface. EMODnet's bathymetry viewer covers the entire European Atlantic and Mediterranean at a resolution that resolves canyons, shelves, and reef systems. It is free. GEBCO's global grid is the alternative for coastlines outside Europe. Neither takes more than a browser tab.
If Yes
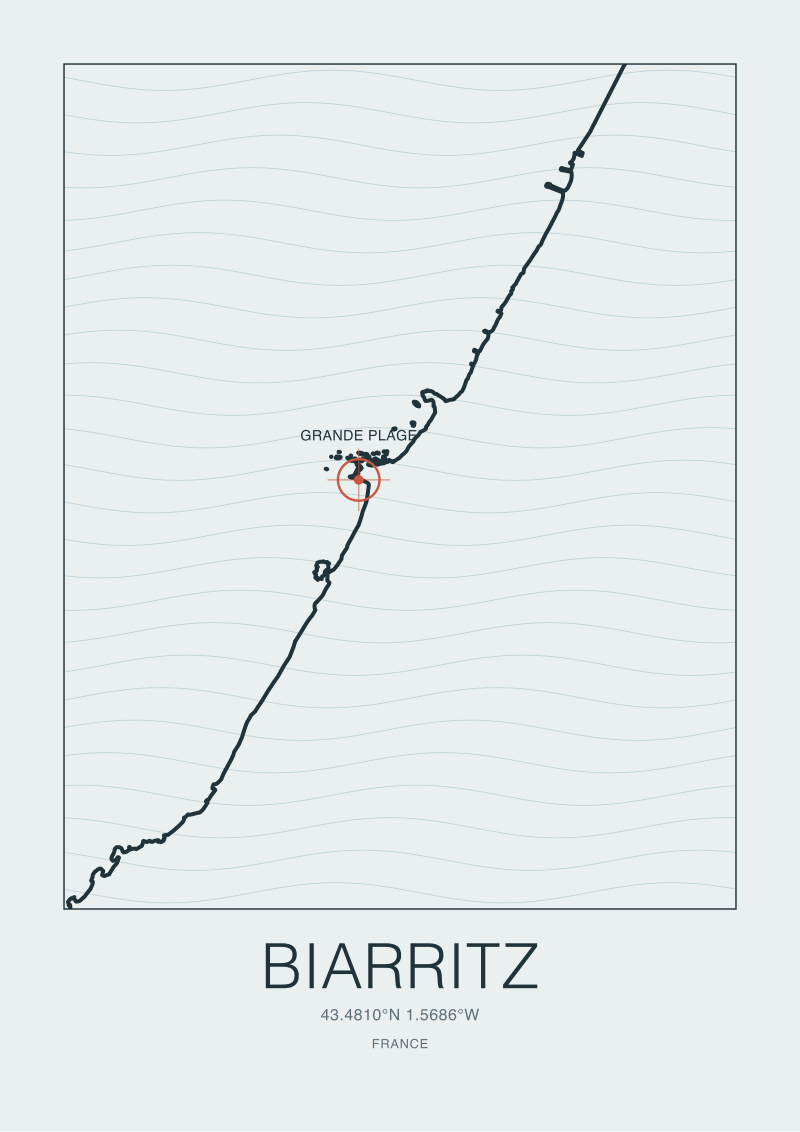
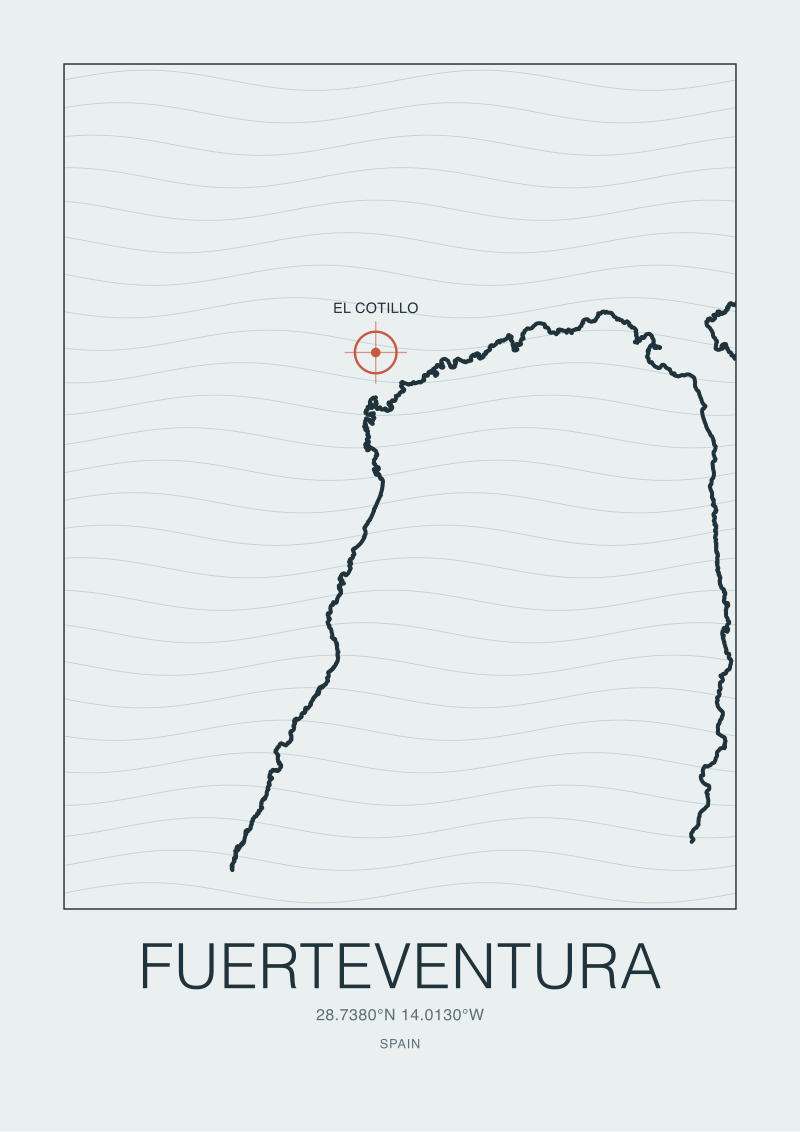
If you can already picture, roughly, what the seabed looks like from your break out to the twenty-metre isobath, you are in a small minority. Skip to Question 2. But confirm one thing first: the coast's aspect — the compass direction the shoreline actually faces. Biarritz's Grande Plage faces west-northwest; Ericeira's Ribeira d'Ilhas faces west; El Cotillo on Fuerteventura's northwest corner faces almost due northwest. A swell arriving from the north-northwest is a different animal at each of these three, even if the app reports the same height. Match swell direction to coastal aspect before you match height to hunger.
If No
Open the bathymetric chart before you open the surf app. Look for three features. First: canyons or trenches perpendicular to the coast — these focus swell energy onto specific shorelines, sometimes doubling the effective wave height at the beach relative to open water. Second: continental shelves — a wide, gradual shelf disperses swell energy over distance, so a big open-ocean reading arrives at the sand tamer than it looks. Third: rocky headlands and reef systems within a kilometre of your break — these bend waves around themselves (refraction), producing the point-break geometry that makes some spots work on days when everything else is flat. Once you have looked, you will notice the same swell reading means different things at different breaks a few kilometres apart. That is the whole point.
Question 2: Are You Checking Swell for a Reef, a Point, or a Beach Break?
The three coastal typologies respond to swell in three different ways, and every honest forecast needs to know which one it is looking at. This is where the app's single number really begins to fail. A reef break stops being useful at a swell size where a beach break is just warming up; a point break is legible in a wind pattern that ruins a reef.
The category is not always obvious from a map. Ribeira d'Ilhas is a reef-and-point system. La Gravière is a shifting beach break sitting above one of the deepest coastal canyons in Europe. El Cotillo is a stretch of exposed beach breaks with rocky sections between them. Grande Plage at Biarritz is a beach break framed by two headlands. Same word — "surf spot" — four different physical arguments with the sea.
If Yes
If your break is a reef or a point — bedrock beneath, consistent shape year to year — the swell reading is easier to trust because the coast underneath is doing the same thing every time. Focus your check on swell period rather than height. A twelve-second period at 1.5 metres will produce a rideable reef wave; an eight-second period at the same height often will not, because short-period swell is wind chop that has not yet organised. Ribeira d'Ilhas at Ericeira is a canonical example — the reef amplifies long-period Atlantic groundswell, and the local reserve status means the seabed geometry that makes it work is legally protected from development that would alter it.
If No
If your break is a beach break, the swell reading is only one of two variables you need — the other is sand. Sandbars migrate. A beach break that produced world-class waves in October at a given swell size may produce closeouts in February at the same swell size, simply because the sandbar has moved offshore or filled in. Hossegor's La Gravière sits above the Gouf de Capbreton, a submarine canyon that concentrates swell energy onto the shoreline, but the actual break shape is a story about which sandbar is currently under water at which tide. For beach breaks: check swell, check tide, and read the shoreline itself. A local photo from the past 48 hours tells you more than a week of forecast data.
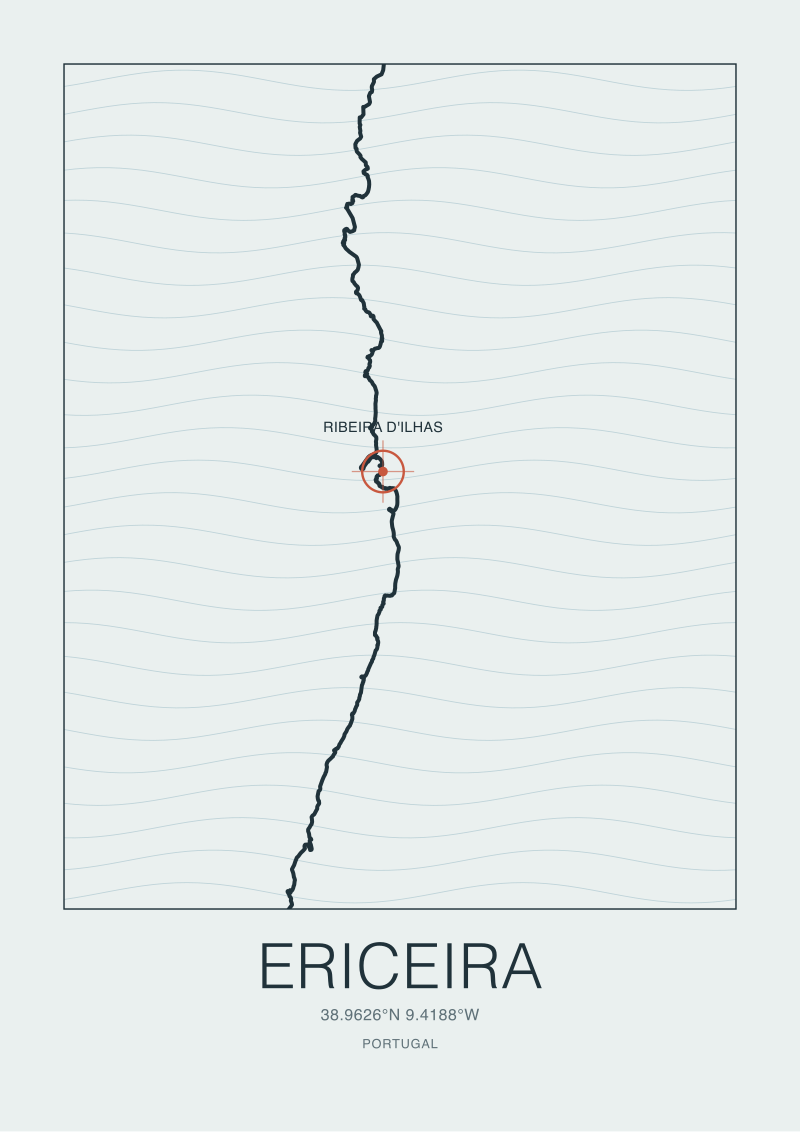 Ericeira
The print from this article · from €29.95
View the print →
Ericeira
The print from this article · from €29.95
View the print →
Question 3: How Far Out Are You Looking — 12 Hours, 72 Hours, or Ten Days?
Forecast horizons are not created equal, and this is where most disappointed surf-checks originate. A twelve-hour window is essentially observation — the swell is already generated, already in transit, and the model is telling you what is arriving. A seventy-two-hour window is genuine forecast: the storm exists but its energy has not yet dispersed across the model's ocean. A ten-day window is atmospheric guesswork dressed up as a wave height.
Different marine models specialise in different horizons. NOAA's WaveWatch III and ECMWF's IFS are the two global backbones — nearly every consumer surf app is a downstream skin over one of them. Their skill degrades measurably past day five. Local high-resolution models (MeteoGalicia's SWAN implementation for the Iberian Atlantic, Météo-France's MFWAM for the Bay of Biscay) add coastline-resolution detail but only for the near horizon.
If Yes
If you are checking within a 72-hour window and you have already answered Questions 1 and 2 honestly, the app number is now doing something useful. Cross-reference two sources — a global model output and, where available, an offshore data buoy reading. The Puertos del Estado buoy network covers the Iberian Atlantic in near real time; the CANDHIS network covers the French Atlantic including the Bay of Biscay. A live buoy reading confirms whether the model's version of reality matches the ocean's. When the two disagree, trust the buoy.
If No
If you are checking a ten-day forecast to decide whether to book a flight, understand what the number is telling you. It is telling you the model's current best guess about atmospheric conditions that have not yet organised into a storm. The height number at day ten has an error margin routinely larger than the number itself. Use long-horizon forecasts to identify seasonal patterns — the North Atlantic groundswell window that runs roughly October through March, the Canary Islands' more consistent trade-wind swell that makes Fuerteventura workable year-round — not to plan a specific session. For that horizon, geography and climatology beat any single forecast run.
If You Answered Everything
Here is the answer map. Read across the three columns to find your combination, then read the recommendation.
| Q1: Coast shape known? | Q2: Reef/point? | Q3: Horizon ≤72h? | Recommendation |
|---|---|---|---|
| Yes | Yes | Yes | Trust the swell period more than the height; cross-check with the nearest live buoy before committing. |
| Yes | Yes | No | Use the long-range read to identify the swell window; recheck 48 hours out with a real model. |
| Yes | No | Yes | Read a recent shoreline photo alongside the forecast; sandbar position is the decisive variable. |
| Yes | No | No | Do not plan a specific beach break session at this horizon; plan a region, not a spot. |
| No | Yes | Yes | Open a bathymetric chart first, then reread the forecast; the reef geometry rewrites the number. |
| No | Yes | No | Learn the coast's shape before the trip; ten-day forecasts are useless without that context. |
| No | No | Yes | Skip the app entirely — go look at the beach, or find someone whose photo shows this week's sand. |
| No | No | No | You are checking the wrong thing; start with the coastal geography, not the forecast. |
The recommendations look repetitive at a glance. They are not — the differences hinge on whether you have done the geographic work first. Answering Yes to Question 1 is the single largest predictor of a forecast that resembles what actually arrives. Skip that step and every downstream check inherits its blind spot.
There is a final observation worth naming. A forecast is a probabilistic statement about a physical system. The system is the ocean, the seabed, the wind field, and the coastline geometry in interaction. The app collapses that system into a scalar. Our order of operations — coast first, break type second, horizon third, number fourth — is not surf pedantry. It is how you read any complex system: understand the substrate before you read the signal.
None of this tells you what the swell will actually do at your specific break at 06:47 on Saturday morning. That question — the one about your break, your tide window, your sandbar as of this week — is where the local knowledge starts, and it is not something any forecast, however good, can hand you.
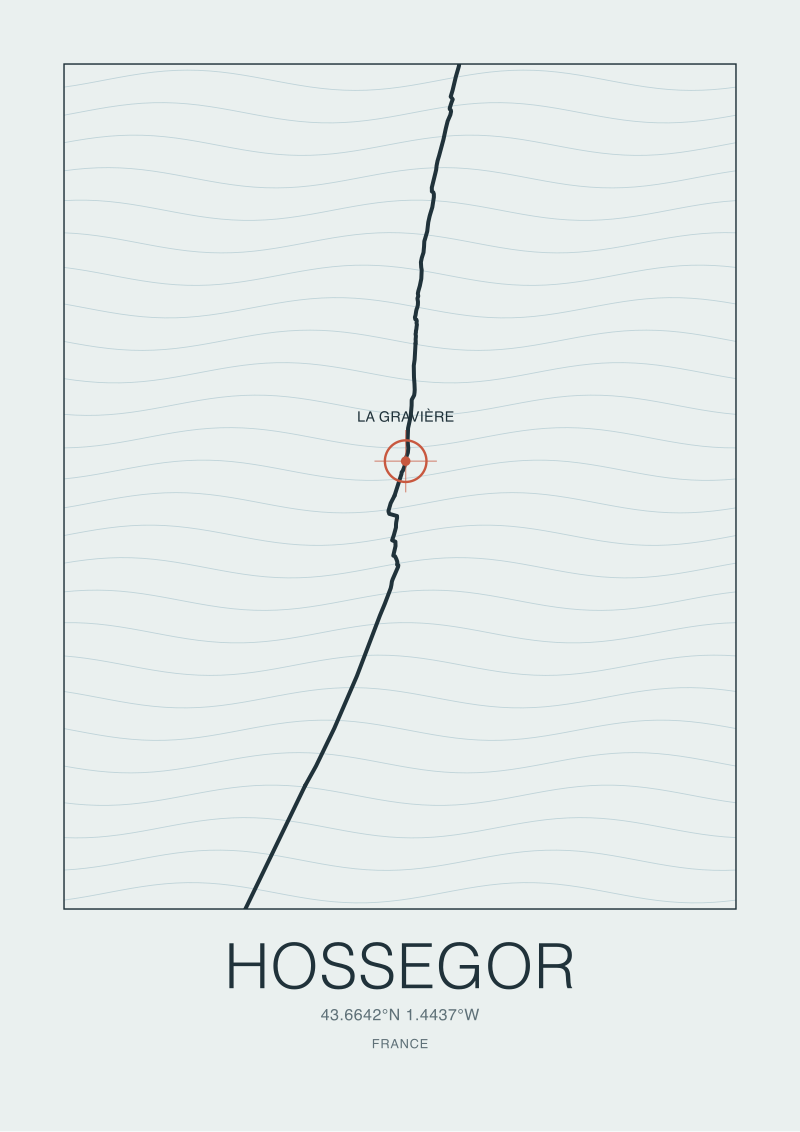 Hossegor
The print from this article · from €29.95
View the print →
Hossegor
The print from this article · from €29.95
View the print →
FAQ
What is swell, exactly, and how is it different from surf?
Swell is wave energy that has organised over long fetches of open ocean, travelling in coherent trains after the wind that generated it has moved on. Surf is what that swell becomes when it meets the seabed near a coast — the wave rearing up, breaking, and dispersing its energy. A forecast quotes swell in open water; what breaks at the beach is a downstream product of that swell plus bathymetry, coastal geometry, tide, and local wind.
Which free tools do you use to check bathymetry before checking swell?
For European Atlantic and Mediterranean coasts, EMODnet's bathymetric viewer resolves canyons, shelves, and reef systems at a workable resolution. GEBCO's global grid covers everywhere else at coarser resolution but is usable. Both run in a browser tab with no account. For live buoy data, Puertos del Estado covers Iberian Atlantic coasts and CANDHIS covers the French Atlantic. All four are public infrastructure, funded by public science budgets.
What swell period is considered "groundswell" versus wind chop?
The rough threshold is a peak period of about ten to twelve seconds. Below that, the wave train is closer to wind sea — chop generated locally that has not yet organised into coherent groundswell. Above twelve seconds you are looking at swell that has travelled long enough to sort itself by wavelength, which is what produces the clean, spaced-out lines associated with quality surf. Long-period swell also refracts more strongly, which is why period matters more than height at reef breaks.
How much can bathymetry actually change the wave height at the shore?
Substantially. A submarine canyon that focuses swell energy — Nazaré's canyon in Portugal being the well-documented extreme case — can produce coastal wave heights well in excess of the open-water reading. Conversely, a broad continental shelf dissipates swell energy over distance, so shorelines behind wide shelves receive tamer waves than the offshore number suggests. This is why identical forecasts produce dramatically different sessions at breaks only a few kilometres apart.
Do long-range surf forecasts have any use if their skill degrades past day five?
Yes, but for climatological rather than tactical decisions. A ten-day forecast is not reliable enough to plan a specific session, but it is useful for confirming that a seasonal pattern is behaving as expected — the North Atlantic groundswell window through winter, the Canaries' trade-wind consistency year-round. Use long-range as a coarse filter for whether the ocean is producing anything in your region; use 72-hour and shorter horizons for actual planning.
Are surf apps essentially all the same data underneath?
Largely, yes. Most consumer surf forecasting apps are downstream skins over one of two global wave models — NOAA's WaveWatch III or ECMWF's IFS — sometimes blended with regional models like Météo-France's MFWAM for the Bay of Biscay. What differentiates the apps is interface, spot database, and the local bias corrections they apply, not the underlying physics. This is why two apps quoting different numbers for the same break usually reflect different post-processing, not different observations.
How do I check swell for a coastline I have never surfed before?
Start with a bathymetric map to understand the seafloor from the twenty-metre isobath in to the shore. Then find the coastal aspect — which compass direction the shoreline faces — because a swell arriving perpendicular to the shore behaves entirely differently from a swell arriving obliquely. Read local surf publications for spot type (reef, point, beach) and seasonal patterns. Only then open a forecast. The order matters more than the sophistication of any single tool.
Why does the same forecast produce a good session at Ribeira d'Ilhas and a poor one at La Gravière on the same day?
Because they are different coastal typologies responding to the same input. Ribeira d'Ilhas is a reef-and-point system at Ericeira, where a stable seabed makes long-period Atlantic swell legible and repeatable. La Gravière at Hossegor is a beach break above a submarine canyon, where the wave energy is amplified but the shape depends on where the sandbar happens to sit that month. Same swell, two different physical arguments, two different sessions.
New breaks and 10% off your first print.
One email now with your code. No noise after.