Four coordinates on the Atlantic shelf: Biarritz at 43.4853° N, Hossegor at 43.6713° N, Ericeira at 38.9885° N, Fuerteventura at 28.6745° N. The same low-pressure system spinning off Greenland can send swell to every one of them inside the same 72-hour window. On any given day, only one or two will produce rideable surf. The swell itself does not change meaningfully across those latitudes — the period lengthens, the direction tightens, but the energy is the same water. What changes is the seafloor underneath. The question "is swell good for surfing" assumes swell is the variable. It is not. The coast is.
That reframe is not editorial preference. It is what the coastline data forces you to admit the moment you draw four points on a chart and watch the same storm fan out across them.
What the Numbers Actually Say
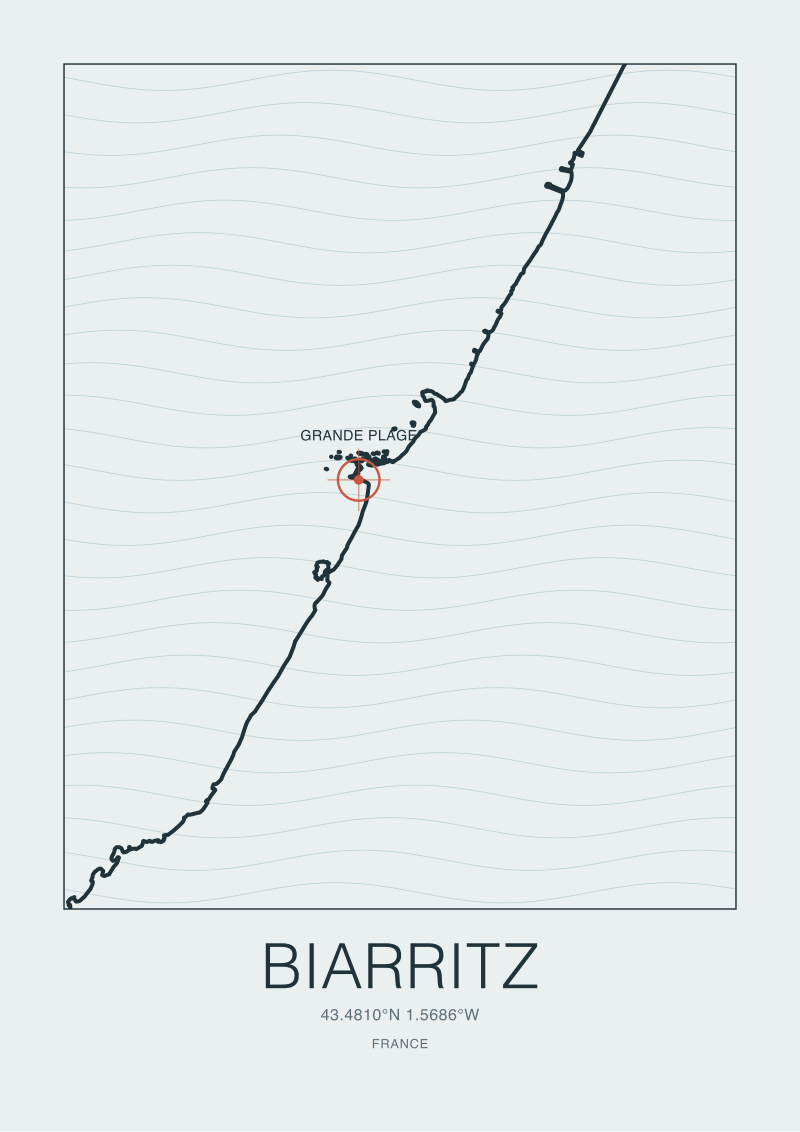
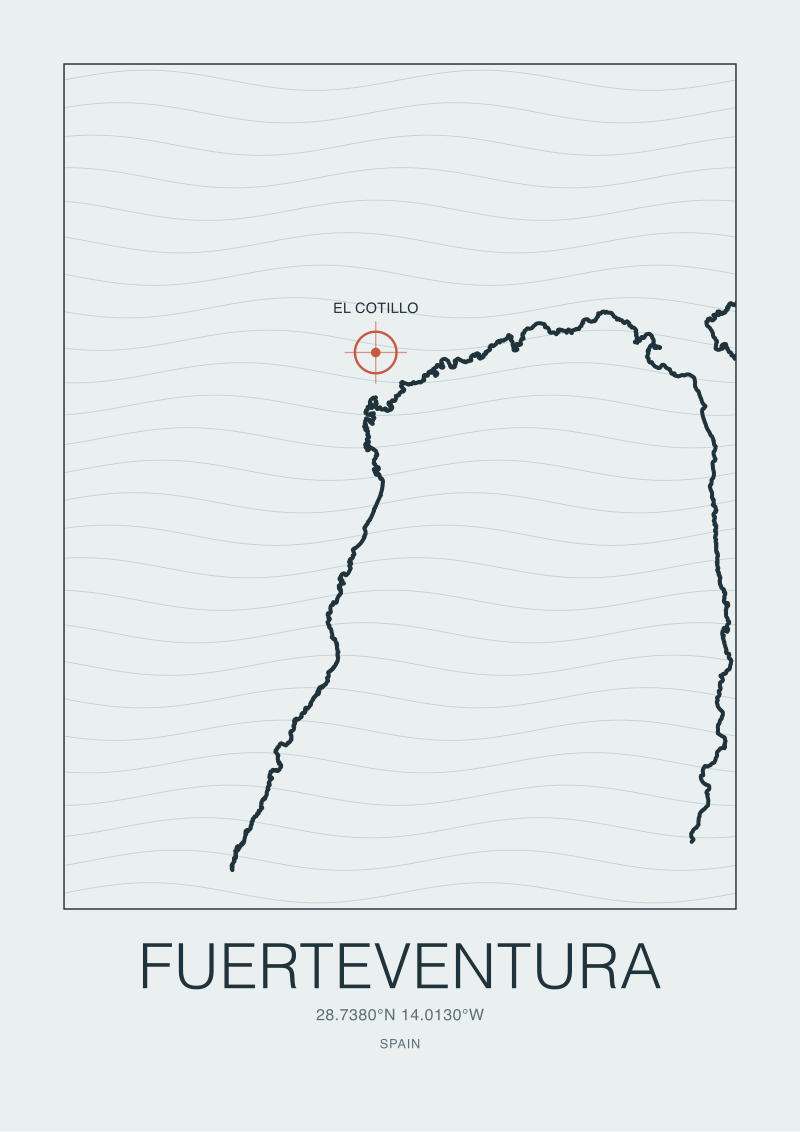
Lay the four coordinates on a single Atlantic chart. Hossegor sits at 43.6713° N, −1.4420° W. Biarritz is 22 kilometres south at 43.4853° N, −1.5584° W. Ericeira drops roughly 500 kilometres further south-west to 38.9885° N, −9.4197° W. Fuerteventura's El Cotillo anchors the sequence at 28.6745° N, −14.0125° W, nearly 1,100 kilometres south of Ericeira and almost 1,700 kilometres from Hossegor. Four latitudes, one ocean.
A single North Atlantic low can push swell energy across the whole fan at once. The physics is boring and well established: wind transfers energy to the sea surface, the energy organises into longer-period waves, those waves radiate outward from the fetch. By the time the swell reaches the European shelf, it has been travelling for days. Period lengthens. Direction cleans up. The energy that arrives at Hossegor on Tuesday morning is, in gross terms, the same energy that reaches El Cotillo on Wednesday evening.
Here is where the receipt stops making sense if you only read the swell forecast. Hossegor and Biarritz sit 22 kilometres apart on the same stretch of French Basque coast. They receive the same swell, from the same direction, with the same period, within the same tide window. One of them, on a given day, will produce world-tour quality surf. The other will produce closeouts, or nothing, or a wave the locals describe with a shrug. The swell did not vote. The seafloor did.
Then widen the lens. Ericeira, 500 kilometres south, catches the same system a few hours later, with slightly less north in the direction and slightly more west. Its coast faces a different quadrant of the compass. A swell that lights up La Gravière at Hossegor may barely wrap into Ribeira d'Ilhas, or it may do the opposite. Fuerteventura, deep in the Canaries, filters the same storm through 1,700 kilometres of ocean before it meets the volcanic shelf at El Cotillo. The energy arrives cleaner, longer-period, more refracted. Same low. Four very different arrivals.
The receipt is this: swell is one variable with a handful of parameters — significant height, peak period, direction, duration. The coast is dozens of variables stacked on top of each other, most of them invisible from the surface. Asking whether a swell is "good for surfing" without naming the coast is asking whether a key fits a lock without naming the door.
What Nobody Mentions
The swell forecast tells you about the energy approaching a coast. It does not tell you what the coast does with it. That translation layer — the one between offshore energy and breaking wave — is bathymetry, and it is where almost every honest conversation about surf lives.
Bathymetry is the shape of the seafloor. When a swell is in deep water, its energy is distributed through the full water column. The wave is a long, low undulation moving faster than most people expect. As it approaches shallower water — typically starting at a depth roughly half the wavelength — the base of the wave begins to feel the bottom. Drag slows the lower portion of the wave. The top keeps moving. The wave shortens, steepens, and eventually breaks.
What breaks and how it breaks depends on the gradient and texture of the bottom. A sudden, steep upward ramp — a reef, a shelf, a submarine ridge — forces the wave to stand up quickly. The result is a hollow, powerful break. A gradual slope lets the wave spill forward across tens of metres of shallowing water. The result is a softer, mushier break. Hossegor's reputation is built on bathymetry: deep-water trenches cut unusually close to shore funnel long-period swell onto sandbars that have been shaped by that same funneling for centuries. The coastline runs along a pine forest for a reason — the geology is doing something specific just offshore, and the forest is a side effect of the dune system that resulted.
Refraction is the second hidden variable. Waves do not travel in rigid straight lines once they feel the bottom. They bend. The portion of the wave in shallower water slows down; the portion still in deeper water keeps its speed. The wavefront pivots. On an irregular coast — headlands, bays, submarine canyons, offshore reefs — this bending concentrates energy on some stretches and starves others. Two beaches a kilometre apart can be, respectively, overhead and clean, or waist-high and bumpy, from the same offshore swell. The refraction pattern made the difference.
Then there is orientation. A coast that faces north-west is open to north-west swell and blind to south swell. A beach tucked into a south-facing cove on a west-facing coast will receive only the swell energy that wraps around the headland and arrives from an angle the geography permits. Biarritz's Grande Plage, Ericeira's Ribeira d'Ilhas, Fuerteventura's El Cotillo — each sits inside a specific orientation window. Outside that window, a monster swell offshore produces almost nothing at the beach.
None of this is in the swell forecast. The forecast tells you what is approaching. The coast decides what arrives.
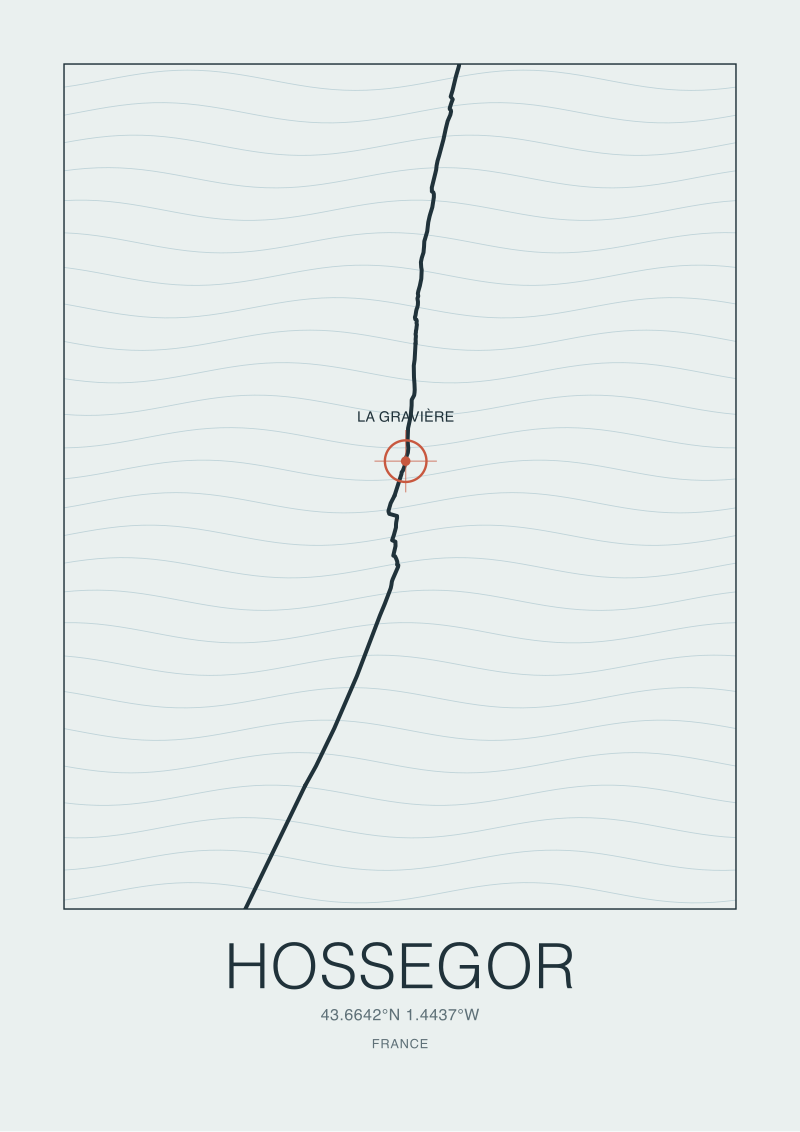 Hossegor
The print from this article · from €29.95
View the print →
Hossegor
The print from this article · from €29.95
View the print →
The Real Cost
Read a swell forecast without reading the coast and you will consistently misjudge days. The miscalibration runs in both directions, and both are expensive — in wasted drives, in missed windows, in confident predictions that embarrass themselves against the actual sea.
The first failure mode is overestimation. A chart shows a long-period swell lighting up western Europe. The numbers look generous: 2.5 metres at 15 seconds, direction clean from the west-north-west. You drive two hours to the coast. You arrive at a beach that faces the wrong quadrant for that specific direction, or sits behind a headland that filters it, or sits over a bottom contour that spills the energy harmlessly across half a kilometre of soft slope. The forecast was correct. Your reading of the coast was not. The waves are there, somewhere, on the same stretch of shoreline — just not at the beach you chose.
The inverse happens more often than people admit. A chart shows a modest, short-period swell. You stay home. Meanwhile, a specific beach break — say, one with a submerged sandbar sculpted by last winter's storms into a near-perfect refraction lens — turns that modest swell into chest-high, mechanical, repeatable waves. You missed it because you were reading the swell, not the coast. The locals knew. They were not reading forecasts. They were reading the beach, in person, for years, and had internalised the translation layer the forecast cannot provide.
Put a figure on it, because the whole receipt-and-reaction frame demands one. The population of surfable days along any given European coast is not the population of days with "good swell" on a chart. It is the intersection of swell, direction, period, tide, wind, and the specific coastal geometry of the specific spot. Empirically — and this comes from honest conversations with people who track their own session logs rather than from any invented statistic — a given spot might turn roughly one in three or one in four forecast-promising days into actually rideable surf. The remaining days are swell that failed to translate.
That translation gap is where almost all surf frustration lives. It is also where the entire economic model of surf tourism quietly misleads itself. A region can advertise its swell climate honestly — the North Atlantic really does push a great deal of energy at these coasts for much of the year — and still disappoint most visitors who book trips based on the swell climate alone. The visitor was promised swell. The visitor received swell. The visitor just did not receive surf, because the coast chose otherwise on their specific week.
The lesson is not that forecasts are useless. They are the necessary input. The lesson is that they are only one input, and treating them as the output is the most expensive mistake in the sport.
If You Only Remember One Thing
Swell is a question the ocean asks. The coast is the answer. The question is roughly the same across whole hemispheres on a given day. The answer is specific to every headland, every sandbar, every submarine contour the swell happens to meet. Any sentence that frames "good swell" as the goal has skipped the step where geography does the actual work.
The honest version of the question is not "is swell good for surfing" but "is this swell good for this coast at this hour." Learn one coast — one real coast, in person, through its tide cycles and its wind patterns and its seasonal sandbars — and the swell forecast becomes the small piece of information it actually is. Learn it only through charts, and the sea will keep producing receipts you cannot read.
Signals to Watch
Watch four things on any coast you care about. First, the direction window — the narrow arc of swell headings the beach actually receives, which is a function of orientation and local shelter. Second, the period threshold — the minimum peak period at which a given bottom contour starts to translate energy into clean waves rather than disordered churn. Third, the tide behaviour — whether the break works on push, on drop, on a specific stage, because the bathymetry that matters is only exposed to the swell in a window of water depth. Fourth, the wind geometry — not just offshore versus onshore in the abstract, but the specific angle at which the local wind interacts with the specific orientation of the specific break.
Those four signals, read against any given swell forecast, do more than any swell chart alone. They are also what the coastline itself is telling you, if you spend enough time drawing it before you try to ride it.
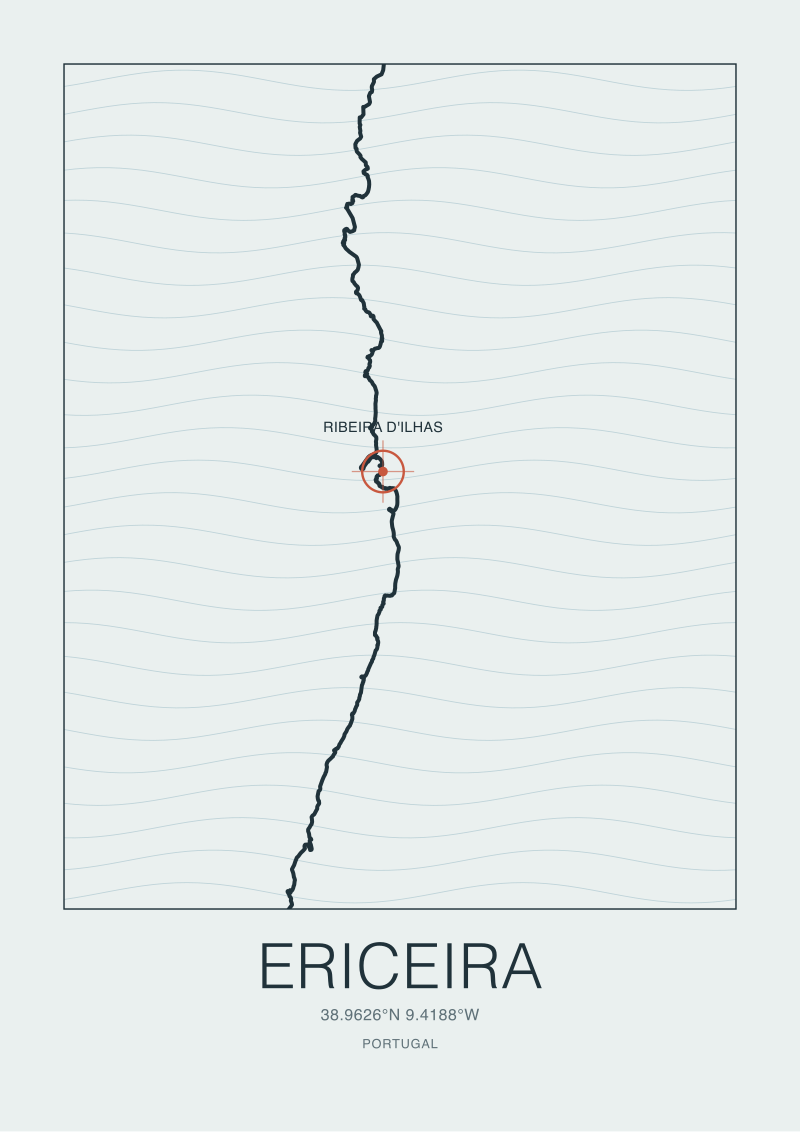 Ericeira
The print from this article · from €29.95
View the print →
Ericeira
The print from this article · from €29.95
View the print →
FAQ
Does a bigger swell always mean better surf?
No. Swell size is only one input, and past a certain threshold it becomes counter-productive for most spots. A beach shaped to translate 1.5-metre, 12-second swell cleanly may close out entirely when the same beach receives a 3-metre, 15-second swell, because the water depth over its sandbars is wrong for that energy. Larger swells also push breaking zones further from shore, change the way waves refract around headlands, and often arrive with the storm winds that disorder the sea surface.
Why do two beaches a kilometre apart surf completely differently on the same swell?
Because the seafloor and the coastal orientation change over very short distances. The portion of a wavefront that reaches each beach has refracted through a different path, over different bottom contours, into a shoreline facing a slightly different direction. One beach may sit in the concentration zone of a submarine ridge; its neighbour may sit in the shadow of a headland. Same swell, radically different arrivals. This is why local knowledge compounds — the translation is spatial, not just temporal.
What is swell period and why does it matter more than height?
Swell period is the time, in seconds, between successive wave crests passing a fixed point. Longer periods mean the wave carries its energy deeper in the water column and interacts with the seafloor further offshore. A 12-second swell behaves fundamentally differently from a 7-second swell of the same height — it refracts more, wraps further around headlands, and breaks with more organised power. For many European reefs and point breaks, period is the pass/fail variable, not height.
Can a coast have good swell but no surf?
Yes, routinely. Some coasts receive abundant swell energy but lack the bathymetry to translate it — the bottom is too deep too close to shore, or the shelf is too gradual, or the orientation is wrong for the dominant swell direction. The energy is there. It simply never organises into a breaking wave in a form a surfer can ride. The inverse — a coast with sparse swell climate but exceptional bathymetry — produces fewer but often higher-quality days.
How does tide change what the swell produces?
Tide changes the water depth over the breaking zone, which changes the point at which incoming swell feels the bottom and begins to shoal. A reef that produces clean, hollow waves at mid-tide can be a sucking, exposed hazard at low tide and a soft, unbreaking shoulder at high tide. Beach breaks shift their breaking zone shoreward and seaward across the tide cycle. The swell is unchanged; the coast's response to it moves with the water level.
Why does wind direction matter if the swell is already there?
Wind acts on the wave face in the final metres before it breaks. An offshore wind — blowing from land to sea — holds the lip up, grooming the face into a cleaner surface and often making the wave break later and more vertically. Onshore wind pushes the wave from behind, collapsing it early and roughening the surface. The swell underneath is identical in both cases. The rideable surface of it is not.
Are the four coasts in this article interchangeable on the same swell?
No. Biarritz, Hossegor, Ericeira, and Fuerteventura sit on different latitudes, face different quadrants, and sit over very different bottom contours. A single North Atlantic storm will deliver surf-grade conditions to one or two of them while leaving the others flat, blown-out, or closed-out. Treating them as interchangeable targets for the same forecast is one of the clearest ways to mistime a surf trip.
What is the single best way to learn a coast's translation layer?
Spend repeated time at one specific break across a full seasonal cycle, logging what you see against what the forecast said. Not a weekend trip — months. Watch the sandbars shift after storms. Note which tide stages work for which swell directions. Track the wind angles that actually clean the face versus those that only look offshore on paper. The map and the forecast become legible only after the coast has taught you what it does with them.
New breaks and 10% off your first print.
One email now with your code. No noise after.