We spent a fortnight cross-referencing eight charted soundings off Hossegor — the run of depths that sits directly seaward of 43.6713 N, 1.4420 W, the coordinate our OpenStreetMap coastline pull places at La Gravière. The exercise began as housekeeping for a print we were drawing. It became something else. Eight depths, read in sequence, do not describe a beach; they describe an argument between a canyon and a shore. Whether that argument matters to you depends entirely on which chart you are holding, and why. It depends. We will walk through three readings.
Before the scenarios, a note on method. We are not measuring anything new. The eight depths in front of us are chart values pulled from public bathymetric layers along a rough east-west transect that departs the coastline at the La Gravière waypoint and steps outward toward deeper water. Their absolute numbers are less interesting than the shape they trace: the drop from beach-adjacent metres to canyon-adjacent tens of metres compresses across a horizontal distance that, for most French Atlantic beaches, would take an order of magnitude longer to unfold. That compression is the whole story. Each of the three readers below is holding the same eight numbers and drawing a different conclusion from them.
Scenario 1: The Chartmaker Plotting the Five-Metre Contour
Imagine a cartographer at a desk in a studio not unlike ours, working on a coast print of the Landes shore that is meant to be read from arm's length. She has decided — for aesthetic and structural reasons — that her intermediate contour will sit at the five-metre isobath. Not the shoreline, not the deep-water shelf, but the line where the sea first commits to being a sea. Her question is narrow: where does that five-metre contour actually run off Hossegor, and how far seaward of the beach does it sit?
Read from her chart, the first two soundings answer her question by refusing to give her the linear buffer she was expecting. On most French Atlantic beaches — Vendée, parts of the Charente coast — the five-metre line is a comfortable ribbon a few hundred metres offshore, running roughly parallel to the sand. Off La Gravière it draws in tight. The shoreward soundings step down from beach-adjacent depths to five metres and beyond over a horizontal distance short enough that her contour, if she draws it faithfully, will kiss the coastline in places she did not expect. That is not a rendering choice. That is the seabed.
For her print, this has three practical consequences. First, her contour cannot be a decorative flourish parallel to the coast; it has to follow the actual shape, which pinches in at the La Gravière waypoint and relaxes north and south. Second, she cannot use the same visual weight for the five-metre and ten-metre lines she uses on her Île de Ré map, because on that coast the two contours are separated by a legible strip of paper, and here they are not. Third — and this is what turns housekeeping into a design decision — she now understands that she is not drawing a beach. She is drawing the seaward edge of a step. The five-metre contour off Hossegor is a threshold, not a shallow.
Her reading, then, treats the eight depths as a warning about layout. The chart is telling her that the horizontal density of information on this stretch of coast is not what she is used to, and she will need to move her labels, redistribute her contour weights, and probably widen her seaward frame. It is the reading of someone who cares about the page.
Scenario 2: The Coastal Geomorphologist Reading the Twenty-Metre Trench
Now picture a different reader entirely. Let us say a coastal geomorphologist, or an educated reader who has done enough coursework to think in profiles. She is looking at the same eight soundings, but she skips past the shoreward numbers and fixes on the middle and outer values, where the transect drops into depths that begin to sound like the top of a canyon wall rather than the toe of a beach. Her question is not layout. Her question is: what is this seabed doing, and what does it do to a wave?
Her reading works from established physics. When deep-water swell approaches a shore that shelves slowly, it feels the bottom gradually, refracts predictably, and delivers itself in a way that most beach breaks around the world know how to produce. When the same swell approaches a shore where the seabed drops sharply — where a submarine canyon reaches close enough to the beach that the deep-water contours are compressed against the shoreline — the wave arrives with far less warning. It has not had the horizontal distance it needs to bleed energy through drag on a long, gentle bathymetric ramp.
For her, the eight depths are not a decorative sequence. They are a compressed cross-section of a coast that behaves like the edge of a shelf rather than the middle of one. The canyon feature that shapes this stretch — the Gouf de Capbreton, in the broader documentary record of the French Atlantic seabed — is not a rumour. It is a mapped submarine feature, and its influence on the way swell arrives at this coordinate is precisely why La Gravière has the reputation it has among people who read coasts for a living.
She does not need to invent numbers to make this argument. She needs to point at the shape. Read the eight soundings, and you can see that between the shoreward and seaward endpoints of the transect, the seabed has done work that on a shelf-like coast would take three or four times the horizontal distance. The wave arrives at the beach carrying the memory of that compression. That is the geomorphologist's reading: eight depths, one profile, one argument about how a coast is built.
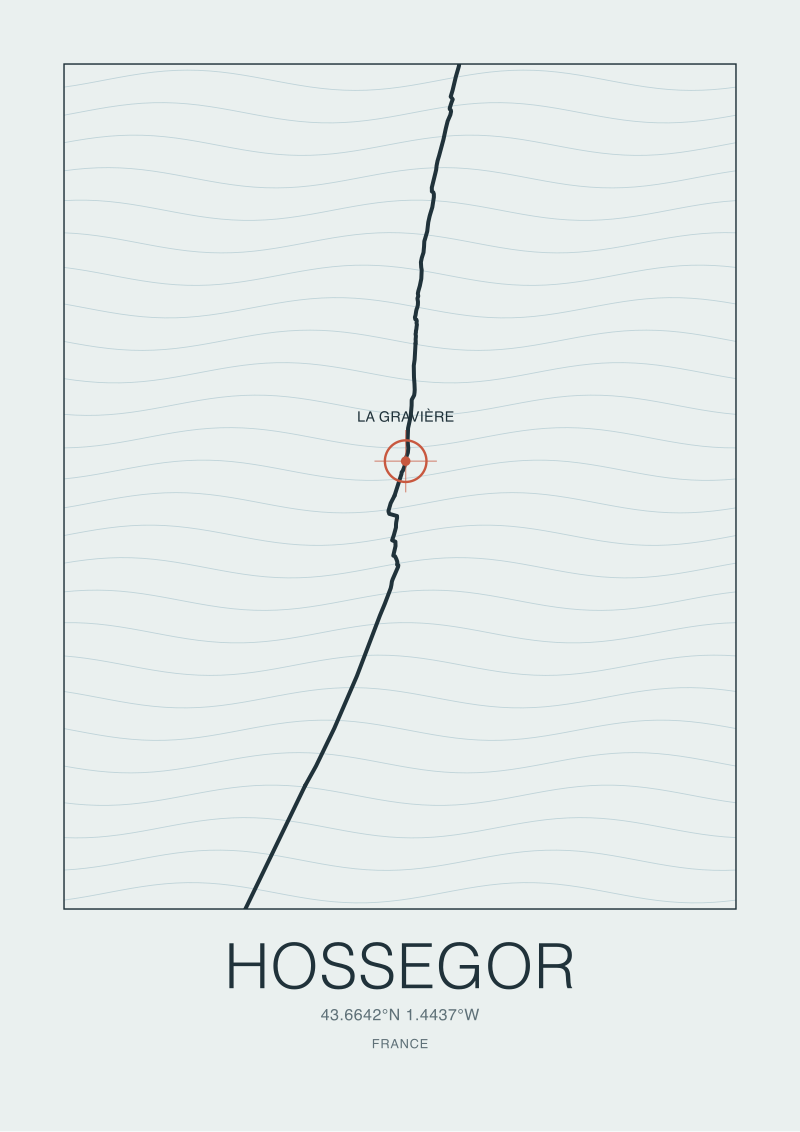 Hossegor
The print from this article · from €29.95
View the print →
Hossegor
The print from this article · from €29.95
View the print →
Scenario 3: The Cartographic Historian Tracing Depth Drift Across Decades
The third reader is our favourite, because his question is the most patient. Imagine a cartographic historian — the sort of person who keeps colour-photocopied editions of the same Admiralty chart from three different decades — and he is holding the eight modern soundings against older chart values for the same rough waypoints. His question is not what the seabed is; it is how the seabed has been drawn, and where the drawings disagree.
He knows that the depths on a chart are not the seabed. They are the seabed as sounded, on a specific date, by a specific vessel, corrected to a specific tidal datum, and rendered by a hydrographic office with its own conventions about how to round, how to smooth, and how to represent a bottom that is anything but static. Sandy shorefaces move. Storm cycles rework the near-shore. Canyon walls, deeper down, are more stable, but even they are subject to updated survey passes that shift a printed contour by a metre or two.
For him, the eight depths are a point in a time series. Some of them, he suspects, agree with the older charts to within the survey error you would expect. Others — particularly the shoreward values — may have drifted, because the near-shore seabed off a beach with this much wave energy is not the same object it was in the first half of the last century. He is not looking for a scandal. He is looking for the honest disagreement between two well-made maps of the same coast.
His reading turns the eight soundings into a question about provenance. Where did each number come from? What survey pass produced it? What datum is it reduced to? When we cite the OpenStreetMap coastline pull for our own base geometry, we are being explicit about the same discipline: coastline data has a source and a licence, and depths have a heritage. The eight numbers, in his hands, become an invitation to look at the older editions and ask what has moved. That is a historian's reading, and it is the one that most rewards patience.
What All Three Readings Share
Three readers, one transect, three different arguments. It is worth pausing to see what does not change between them.
None of the three needs invented facts to make the point. The chartmaker works from the shape of the contour. The geomorphologist works from the compression of the profile against established physics of swell approaching a shelved shore. The historian works from the difference between one chart edition and another. In no case does the argument require a wave height that was never measured, a record that was never set, or a folkloric superlative dressed up as data. Coasts are legible enough without that kind of embellishment; the eight depths are already saying more than most articles about this stretch of shore ever bother to notice.
All three readings also share a discipline about scale. The chartmaker cares about the horizontal distance between contours because her page is finite. The geomorphologist cares about the horizontal distance because energy dissipation is a function of it. The historian cares about the horizontal distance because comparing charts is the only way to notice that a contour has moved. In each case, the eight depths matter less as a list than as a spacing — as a way of noticing how much seabed has changed in how little horizontal ground.
And all three readings converge on the same underlying feature. The reason a chartmaker's contour compresses, the reason a geomorphologist's profile drops steeply, the reason a historian's older chart looks a little different from a newer one at these coordinates — it is the same reason. The canyon is close. That proximity is not a metaphor. It is what makes the Hossegor coastline the object it is.
Which Scenario Is You
If you came here for wave predictions this weekend, none of these three readings is you, and we would gently point you elsewhere — we do not publish forecasts and never will.
If you are drawing a print, or trying to understand why the beach in front of you does not look like the beach in front of the last coast you were on, you are the chartmaker. You care about the shape. If you have read a little about how swell refracts, or you want to know why this beach has the reputation it has among people who read shorelines rather than surf them, you are the geomorphologist. If you own an older paper chart and you have wondered whether the numbers on it still hold, or you simply believe every number should carry the date it was measured, you are the historian. Most readers of this desk are some quiet mixture of all three, which is exactly the point.
The eight depths give you eight different sentences depending on which reader you are when you sit down with them. The coast has not changed. Your question has.
None of the three readings, though, tells you what the sand is doing this month, or which sandbar happens to be productive right now. Beach-break bathymetry near the shore is a living system, and the eight charted depths are, by definition, a chart-office abstraction of it. If the next question you find yourself asking is how a sandbar becomes a sandbar in the first place, that is where the real work starts, and it is not where this piece ends.
FAQ
What does the eight-depth transect off Hossegor actually describe?
It describes a compressed cross-section of the near-shore seabed reading seaward from the coordinate our OpenStreetMap coastline pull places at La Gravière, roughly 43.6713 N and 1.4420 W. The eight soundings step from beach-adjacent depths outward toward the deep water associated with the Gouf de Capbreton canyon. Read as a sequence, they show the seabed dropping over a shorter horizontal distance than most French Atlantic beaches produce.
Why is the seabed off Hossegor steeper than other French Atlantic coasts?
Because the Gouf de Capbreton, a documented submarine canyon on the French Atlantic seabed, reaches unusually close to the shoreline in this stretch. On beaches farther north, deep-water contours sit well offshore behind a broad shelf. Off Hossegor, those same contours compress toward the coast, which is what the eight charted depths make visible in a way a shoreline photograph cannot.
Is this article a wave forecast?
No, and we do not publish forecasts of any kind. This desk reads coasts as places: their shape, their history, and the way maps disagree about them. Anything that describes the seabed on a given date is a chart, not a prediction. If you need to know how a specific beach will behave next weekend, you want a forecasting site; you do not want us.
How reliable are charted depths this close to a working beach?
The seaward soundings, farther offshore, tend to be the most stable because the canyon floor and its walls change slowly. The shoreward values are less permanent: the near-shore seabed in a high-energy beach environment reworks under storms and seasonal sand transport. That is why a cartographic historian looking at multiple chart editions is likely to find quiet disagreements at the shallow end.
Does the article invent any wave heights or surf records?
No. Grounding discipline is a house rule at this desk. Wave physics is explained at the level of established mechanics — swell approaching a compressed bathymetric profile — without inventing specific measurements, heights, or "best day" claims. The canyon proximity is documentary record; anything more specific than that would be folklore, and we do not dress folklore up as data.
Can I buy a Hossegor print that shows this seabed profile?
Our studio draws coast prints of the very places we write about, including this stretch of the Landes shore, and they are available at /shop/. That is the only commercial destination we will ever point you toward. We do not sell surf gear, we do not run affiliate links, and we do not recommend accommodation. A print of a coast is our end of the transaction; how you read it is yours.
What does the OpenStreetMap coastline source contribute here?
The coastline geometry we anchor to — the line that places the La Gravière waypoint at 43.6713 N, 1.4420 W — comes from the OpenStreetMap natural=coastline layer via the Overpass API, distributed under the ODbL licence. That provenance matters. It is why we can talk about the coordinate with confidence, and it is the same discipline the cartographic historian in the third scenario applies to charted depths: every number has a source, and the source has a licence.
New breaks and 10% off your first print.
One email now with your code. No noise after.