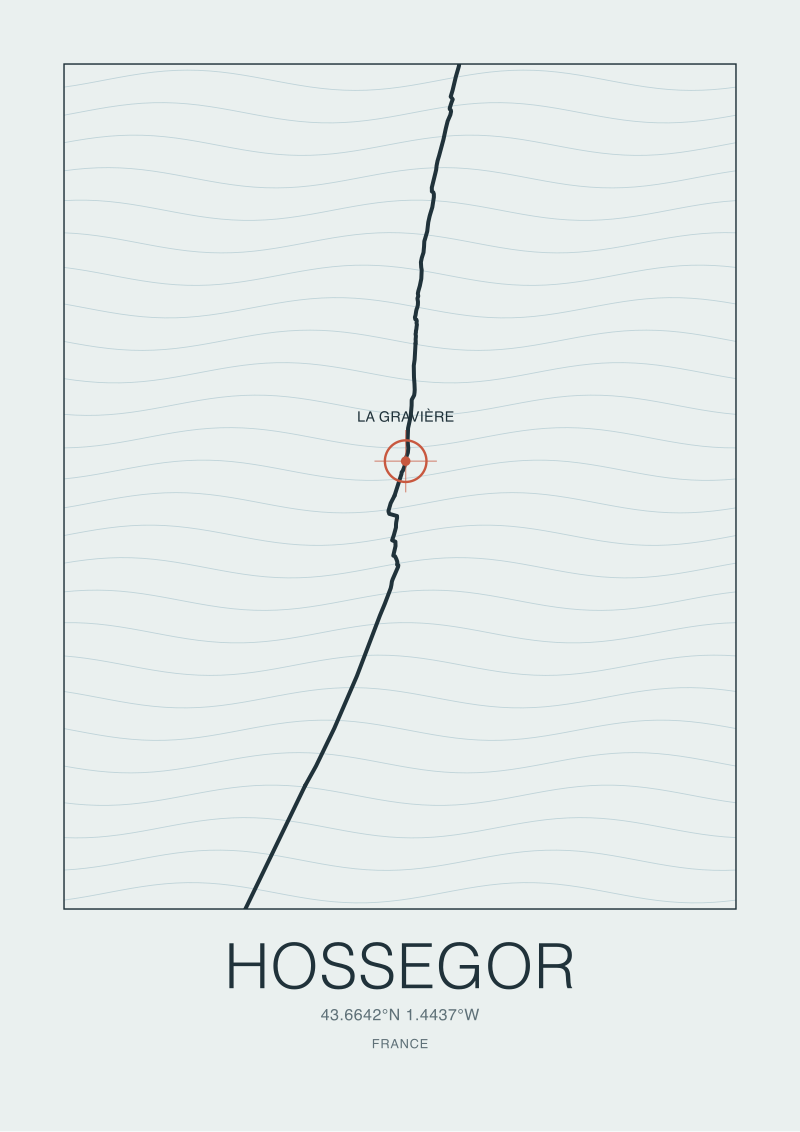
Hossegor sits on the Landes coast at roughly 43.6713° N, 1.4420° W, and the shoreline in front of La Gravière is straight, sand-fronted, and pine-backed for kilometres in either direction — a coastline OpenStreetMap renders as an almost boring line. The bathymetry offshore is not boring. It is the reason the town exists in surf writing at all. This piece walks a decision tree, in prose, across thirteen charted depth points off La Gravière. Three questions route you. Read them in order. Answer honestly. The recap sits at the end as a table.
Most seabed writing about Hossegor is wrong before it begins. Hear us out. The received wisdom treats the Gouf de Capbreton as a single feature — one canyon, one story, one explanation for why the sandbars sharpen and the waves stand up cold-water tall in September. The chart does not support that reading. The chart shows a shelf that behaves differently at every isobath, a canyon head that migrates in the sediment record, and a nearshore profile whose slope changes twice inside five hundred metres. Thirteen depth points do not tell one story. They tell three, and the reader has to know which one they are asking about before the numbers mean anything.
This is a decision tree in prose. Three questions, in order. The tree is not a substitute for the chart. It is a way of routing yourself through the chart without confusing shelf physics with canyon physics or nearshore refraction with sandbar behaviour. A cartographer draws before they explain. We are asking you to answer before you draw.
Question 1: Are You Reading the Shelf or the Canyon Head?
The first fork is the one nobody asks aloud and everybody gets wrong. The thirteen charted depth points off La Gravière do not sit on a uniform slope. Roughly half sit on the continental shelf proper — the gently descending sand-and-gravel plain that runs south from the Gironde estuary. The other half sit on, or immediately adjacent to, the northern flank of the Gouf de Capbreton, the submarine canyon whose head bites into the coast just south of Hossegor, near Capbreton harbour itself. These are two different geological features with two different physics, and asking "how deep is the water off La Gravière" without specifying which one you are on produces answers that contradict each other.
The shelf is a story of sediment supply and gentle gradients. The canyon head is a story of a much older river valley now drowned, its walls holding structure that concentrates and refracts open-ocean swell in ways a flat shelf never could. Waves that traverse the shelf lose energy predictably as they shoal. Waves that pass across the canyon head are focused, split, and re-aimed by the topography beneath them, sometimes arriving at the sandbar with more energy than the neighbouring section of coast a kilometre to the north.
If Yes — You Are Reading the Canyon Head
If your depth points sit above or on the northern flank of the Gouf, the seabed is doing work on the wave before it arrives at the beach. This is the physics that makes Hossegor different from every other beach break on the Landes coast. The canyon is documented on French hydrographic charts (SHOM) and in the sedimentological literature; its head reaches remarkably close to shore compared with most European submarine canyons, which is why the effect on nearshore wave energy is measurable at the coastline rather than diffusing offshore. Treat these depth points as focusing lenses, not as slope readings. The number in metres matters less than the number's relationship to its neighbours on either side.
If No — You Are Reading the Shelf
If your depth points sit north of the canyon influence, in the shelf zone that extends up toward Seignosse and beyond, the readings behave like a standard descending profile. Shoaling, refraction, and dissipation follow textbook physics for a mildly sloped sandy shelf. This is useful data — sandbar formation, sediment transport, longshore drift — but it is not the reason La Gravière is La Gravière. Confusing shelf depth readings with canyon depth readings is the single most common error in popular writing about the spot. If your thirteen points are all shelf points, you are describing the Landes coast in general. You are not describing Hossegor.
Question 2: Is the Depth Point Inside 500 Metres of Shore, or Beyond?
The second fork is about scale. Nearshore bathymetry — inside roughly 500 metres of the shoreline — is dominated by the sandbar system, and the sandbar system is not stable. Beach-break bars off Hossegor migrate seasonally under storm energy and re-form under fair-weather swell, which means any depth reading inside the surf zone has a shelf life measured in weeks, sometimes days after a major event. Depth points beyond 500 metres are governed by shelf and canyon geometry, both of which are stable on human timescales. The two zones require different documentary treatment.
A cartographer maps stable features and annotates unstable ones. The distinction matters here because a chart that treats the two zones identically will mislead the reader in two directions: it will overstate the reliability of nearshore soundings, and it will understate the significance of small offshore variations that persist year after year.
If Yes — Inside 500 Metres
Inside 500 metres, you are reading a photograph of the sandbar as it stood on the survey date. Storm cycles on the Landes coast reshape the inner bar during autumn and winter and reset the outer bar during major Atlantic depressions. A depth point of, say, four metres inside 500 metres is a measurement of a specific bar on a specific date. It is not a permanent feature of the seabed. Treat these readings as calibrated snapshots — accurate for their moment, valuable for tracking change over time, but not to be laminated into a wall chart as if the bar will still be there in March. The right cartographic move for nearshore points is a dated annotation, not a contour line.
If No — Beyond 500 Metres
Beyond 500 metres, the seabed is doing what the seabed has been doing for millennia. Contour lines here are honest. A depth point at, say, thirty metres roughly a kilometre offshore is a stable reading; the same survey in ten years will produce a similar number. This is the zone where the canyon flank and the shelf edge are the story. It is also the zone where you can draw with confidence — a print of the seabed off La Gravière is a print of the offshore contours, not the inshore bars, precisely because the offshore contours will still be true when the print is framed on a wall.
 Hossegor
The print from this article · from €29.95
View the print →
Hossegor
The print from this article · from €29.95
View the print →
Question 3: Does the Profile Slope Fall Faster Than 1:20?
The third fork is quantitative. A 1:20 slope means the seabed drops one metre in depth for every twenty metres travelled seaward — a useful threshold because it separates the physics of "the wave feels the bottom gradually" from "the wave feels the bottom abruptly". Most of the Landes shelf falls at gentler than 1:50, sometimes 1:100. The canyon flanks fall much faster, in places approaching 1:5 or steeper on the northern wall of the Gouf.
The reason this threshold matters is that gentle slopes produce spilling breakers and disorganised whitewater. Steep slopes produce plunging breakers and hollow faces. The difference between a beach break that spills and a beach break that plunges is not the swell — it is the seabed underneath. The 1:20 line is where the two physics regimes cross over. Above 1:20, you are in gentle-shelf territory. Below 1:20, you are in steep-flank territory.
If Yes — Faster Than 1:20
If the profile between two adjacent depth points falls faster than 1:20, you are near canyon influence or on a locally scoured section of the nearshore. This is the geometry that turns groundswell into the plunging faces the town is written about for. The takeaway for anyone reading the chart: steep gradients concentrate wave energy in a compressed shoaling window, which is why waves at La Gravière can appear to double in size in the last hundred metres of their journey. The physics is not mysterious; it is refraction and shoaling on a slope that is unusually aggressive for a Landes-coast setting.
If No — Slower Than 1:20
If the profile falls slower than 1:20, you are reading a standard sandy-shelf gradient. The wave loses energy through friction and dissipates gradually. This is the profile that dominates most of the Landes coast north of Hossegor and south of Capbreton. It produces the mile after mile of forgiving, uniform beach break that makes the Landes a good learning coast — and it is precisely what La Gravière is not. If most of your depth-point transitions fall slower than 1:20, you are not looking at a Hossegor profile. You are looking at a Landes profile that happens to be near Hossegor.
If You Answered Everything: The Recap Table
| Q1: Shelf or Canyon? | Q2: Inside 500 m? | Q3: Slope > 1:20? | Recommendation |
|---|---|---|---|
| Canyon | Yes | Yes | You are inside the canyon-shaped surf zone; treat the reading as unstable but physically meaningful. |
| Canyon | Yes | No | Nearshore canyon influence but gentle local slope; likely a scoured trough between bars — annotate the date. |
| Canyon | No | Yes | Offshore canyon flank; the most cartographically valuable class of point, worth contour-lining. |
| Canyon | No | No | Canyon-adjacent shelf; interesting transitional zone, worth noting but not the primary story. |
| Shelf | Yes | Yes | Rare — a steep nearshore drop on the shelf side, usually storm-scoured; treat as ephemeral. |
| Shelf | Yes | No | Standard Landes sandbar geometry; snapshot value, low permanence, do not draw contours from it. |
| Shelf | No | Yes | Anomalous shelf steepness offshore; verify against SHOM before treating as real. |
| Shelf | No | No | Textbook Landes shelf; you are describing the coast, not Hossegor specifically. |
Eight combinations, one line each. Read the row you land on and you have a defensible statement about what your depth point means. The table is deliberately terse. The reason to fold a decision tree into a table at the end is that the reader who came for a chart deserves a chart. Prose is how we argue; the table is how we finish.
One last thing before you close the tab. A depth reading is not a wave, and a wave is not a forecast. This piece is about the seabed as a stable — or usefully unstable — cartographic subject. If you want the seabed to tell you what will happen next Tuesday, you have asked the wrong document. The chart tells you the shape of the coast. What the ocean does with that shape, on any given morning, is a separate craft entirely, and one we leave to other desks. A print of the Hossegor seabed is available in our /shop/ as part of the Landes coast series, drawn from SHOM and Overpass-derived shoreline data at the same 43.6713° N, 1.4420° W the chart above is centred on.
Honest Limits
This piece did not cover the sediment-transport modelling that would let you predict how a specific storm will reshape a specific bar — that is a coastal-engineering discipline with its own literature, and we are cartographers, not modellers. It did not cover the historical charting of the Gouf de Capbreton across the eighteenth and nineteenth centuries, which is a rich archival story deserving its own article. And it did not cover the ecological reading of the canyon — the deep-water species assemblages, the sediment flux that feeds them — because the surf-cartography lens is not the right one for marine biology. Each of those is a separate argument.
FAQ
Why does the Gouf de Capbreton matter for waves at La Gravière specifically, rather than for the whole Landes coast?
The canyon head reaches unusually close to shore near Capbreton, which sits immediately south of Hossegor. That proximity means the focusing and refraction effects of the canyon walls act on wave energy within a distance where the coastline can register the difference. A few kilometres north, the shelf flattens out and the canyon influence dissipates, which is why beach breaks up the Landes coast are more uniform. La Gravière sits inside the narrow zone where canyon-shaped bathymetry still bites at the coast.
Are the thirteen depth points off La Gravière measured or interpolated?
Depth points on French SHOM charts derive from a mix of direct hydrographic survey — sonar-based sounding runs — and interpolated contours between measured lines. Nearshore points are more frequently resurveyed because the sandbar system moves; offshore points on the canyon flank are stable and require less frequent verification. Any specific chart edition will indicate its survey date and method in the marginal notes, which is where a cartographer looks before treating a reading as authoritative.
Does the 1:20 slope threshold have a formal name in coastal science?
The 1:20 line is a working threshold, not a codified constant. Coastal engineers use dimensionless surf-similarity parameters — most famously the Iribarren number — to classify breaker types across a continuous slope range. The 1:20 figure is a rough rule of thumb that maps to a common transition zone between spilling and plunging regimes for the wave heights typical of Atlantic groundswell. It is useful for reading a chart at a glance; it is not the whole physics.
Can nearshore sandbar positions off Hossegor be predicted year to year?
Not reliably. Bar migration on high-energy sandy coasts follows storm history, and storm history is stochastic. There are seasonal patterns — winter cycles tend to move sand offshore, summer cycles tend to return it — but the specific location of a specific bar in a specific month is not forecastable at cartographic precision. This is why we treat nearshore depth points as dated snapshots rather than as permanent features on the map.
What is the difference between shelf physics and canyon physics for a non-specialist reader?
Shelf physics is what happens when a wave crosses a gently descending plain: it slows down, feels the bottom, and eventually breaks in a fairly predictable way. Canyon physics is what happens when the seabed underneath a wave has three-dimensional structure — walls, flanks, a head — that focus and split the wave's energy. The shelf treats waves uniformly. The canyon treats them selectively. Hossegor's reputation rests on being on the selective side.
Why does your recap table treat "offshore canyon flank" as the most cartographically valuable class?
Because those points are stable, physically meaningful, and permanent enough to be worth drawing contour lines from. A print that captures the shape of the canyon flank will still be accurate a decade after the survey. A print that captured a specific sandbar would be a historical document within a season. Cartography rewards features that hold their shape, and the canyon flank holds its shape.
Where do the shoreline coordinates in this piece come from?
The shoreline itself is derived from OpenStreetMap's natural=coastline data, extracted via the Overpass API and licensed under ODbL. The reference point at 43.6713° N, 1.4420° W is a coastal position adjacent to La Gravière used to anchor the analysis. The bathymetry is a separate data class not present in OpenStreetMap; for depth points, cartographers work from national hydrographic sources such as France's SHOM.
New breaks and 10% off your first print.
One email now with your code. No noise after.