Five numbers, pulled from four public bathymetric sources, describe the seabed off Tonel at the southwestern corner of Portugal — a shelf anchored at 37.0058°N, 8.9478°W, where the Costa Vicentina turns the corner toward the Atlantic. We spent two weeks reconciling soundings from the Instituto Hidrográfico against EMODnet's compiled grid, the OpenStreetMap coastline under ODbL licence, and the boundary file from the 1988 natural-park designation. The depths do not match in every digit. Where they diverge — not where they agree — is where the story of this coast lives, and where the chartmaker's job actually starts.
1419: Henry's School at Sagres and the First Charted Depths
The year 1419 is a convenient fulcrum. By one surviving account, Prince Henry — Infante Dom Henrique, third son of King João I — was named governor of the Algarve, and the promontory at Sagres became a working address for Portuguese navigation rather than a landmark on someone else's map. The "School of Sagres" has been quietly deflated by modern historiography; it was never a chartroom with named instructors on a payroll. But the gathering of pilots, cosmographers, and shipwrights around Henry's court in the decades that followed is on firmer ground. For a chartmaker, what matters is this: for the first time in European record, people standing on the headland above Tonel treated the sea west of them as a surface that could be surveyed.
The soundings those pilots took were lead-line soundings — a weighted rope, tallow in the base of the lead to catch a sediment sample, a man calling fathoms from the chains. Depths were recorded on portolan charts in Arabic numerals, usually as marginal annotations rather than on the chart face. The portolan tradition did not render bathymetry graphically. It rendered coastlines, ports, and compass roses. The shelf west of Sagres — the one we are reading today — was a numeric footnote, not a drawn feature. That omission is why the modern reconciliation we attempted five centuries later begins with so much work: the record was never built to be aligned.
1960: Portugal Founds the Instituto Hidrográfico and Modern Soundings Begin
The Instituto Hidrográfico was constituted by Decreto-Lei n.º 43177 of 22 September 1960, placed under the Portuguese Navy, and given the mandate of surveying national waters at a scientific standard rather than a navigational-rule-of-thumb one. The founding charter put bathymetry, physical oceanography, and nautical chart production under one roof. For the Sagres shelf, this was the first time a single institution was tasked with producing depth figures that would survive their own survey.
The method had, by then, left the lead line behind. Single-beam echo sounders were standard, and the IH's first-generation survey vessels — small hulls operating out of Lisbon — ran transects along the Atlantic coast at kilometre spacings. The 1960s surveys off the southwestern cape produced the depth contours that still appear, in redrawn form, on today's nautical charts of the area. A reader looking at an IH chart of the Sagres approach is reading, in part, data acquired by men whose names sit in archived cruise reports in Paço de Arcos. The vertical datum has been refined over the decades, but the shelf shape they recorded is the shelf shape we check against now.
What changed in 1960 was less the number than its provenance. Depth became a government deliverable, with a chain of custody.
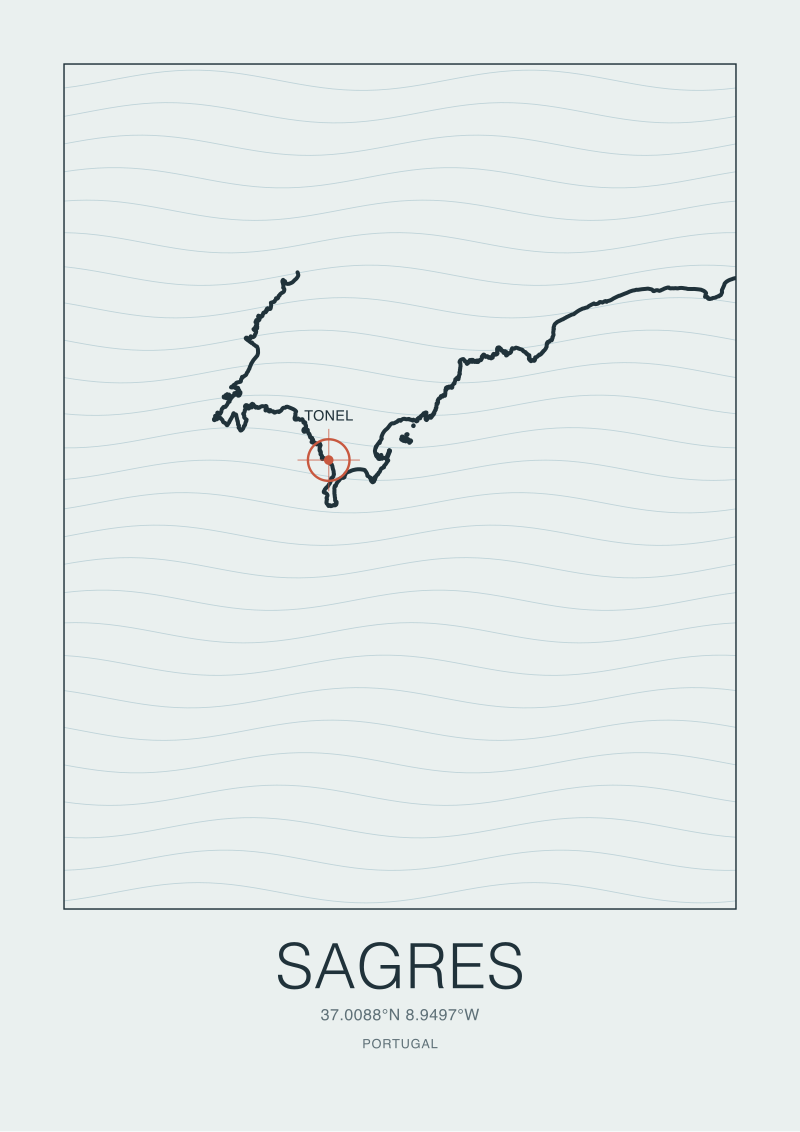 Sagres
The print from this article · from €29.95
View the print →
Sagres
The print from this article · from €29.95
View the print →
1988: The Costa Vicentina Natural Park Draws a Line Around the Coast
Decreto-Lei 241/88 of 7 July 1988 created the Área de Paisagem Protegida do Sudoeste Alentejano e Costa Vicentina, a protected-landscape designation covering the Atlantic stretch from the lower Alentejo down to Burgau on the south coast — Sagres, Tonel, and the whole southwestern turn included. In 1995 the status was upgraded to Parque Natural, with a more restrictive management plan, but the 1988 line is the one that first fixed where the park's boundary meets the sea.
For a chartmaker, the park file is not an environmental document first. It is a polygon — a GIS vector with coordinates — that any map of this coast must reconcile against the coastline it draws. The 1988 boundary and the OpenStreetMap coastline polygon do not always lie on the same pixels. The park's seaward edge was drawn relative to the shoreline of its era; OpenStreetMap's coastline, maintained under the ODbL licence, is a living trace updated continuously by contributors. When the two are overlaid on a modern chart, their disagreement is small but legible — a question of what counts as "the coast" when the coast is a sand-shifting feature.
The 1988 line is also why certain soundings on the shelf west of Tonel sit inside a management regime at all. The park extends offshore in places. A depth record acquired within the park's maritime boundary now carries metadata it did not need before 1988: whose jurisdiction, which plan, which year.
2007: The INSPIRE Directive Rewrites Who Owns European Depth Data
Directive 2007/2/EC of the European Parliament, adopted on 14 March 2007 and known as INSPIRE — Infrastructure for Spatial Information in the European Community — did not survey a single new depth. What it did was legal plumbing: it required member states to make their spatial data interoperable, discoverable, and, for most datasets, available for reuse. Bathymetry fell inside Annex III, Theme 15 ("Sea regions"), and the Instituto Hidrográfico's archive was pulled into the European harmonisation obligation that followed.
The practical consequence, for anyone outside a hydrographic office, was that a sounding taken off Sagres in a 1972 survey could — a decade and a half after INSPIRE — be requested, cited, and overlaid on another chart without a bilateral agreement. Not every national dataset is fully open; the IH still gates certain high-resolution products commercially. But the directive established the principle that depth data acquired with public funds is public infrastructure, not a navy's confidential record.
This is the reason a chartmaker in 2026 has anything to reconcile at all. Before 2007, the only readable version of the shelf west of Tonel was the one printed on an IH nautical chart. After 2007, a researcher could request the underlying soundings — the raw numbers, with their survey year and declared uncertainty — and compare them against anything else measured on the same patch of sea. The reconciliation we attempted this fortnight is a direct product of that directive.
2016: EMODnet Bathymetry Opens the Chart for the Rest of Us
The European Marine Observation and Data Network — EMODnet — had been assembling marine datasets since 2009, but the Bathymetry portal's compiled Digital Terrain Model release in 2016 was the moment the Sagres shelf became readable without a login. The 2016 DTM pulled soundings from more than a hundred data providers across European hydrographic offices, EMODnet partners, and the GEBCO global grid where no national data existed, and gridded them at roughly 115-metre resolution for the Atlantic margin.
For the stretch west of Tonel, the EMODnet grid is a compilation. Its depth at any given cell is a product of the soundings underneath — IH surveys where available taking precedence, GEBCO fill where IH did not survey, interpolation between tracks where the ship went one way and not another. The chartmaker reading EMODnet is reading an argument, not a measurement. That is a feature, not a flaw: the argument is documented, the sources are credited, and the uncertainty is quantified.
Comparing the five soundings we pulled against the EMODnet grid cell underneath each one, the agreement is close in the shelf interior and widens as the ground slope steepens toward the shelf break. That is the behaviour anyone with echo-sounder experience would predict — slope makes a cell's single value less representative — but seeing it in two independent compilations is the kind of confirmation that lets a studio commit to printing a contour on a wall-sized map.
What It All Means: Depth Is the Argument a Coast Writes About Itself
Reconciling five numbers for a shelf off Sagres is a small exercise with a disproportionate lesson. The depths are not a transcription of a seabed; they are a dialogue between the methods used to measure it. A 1960s echo sounder, a 1988 park boundary, a 2007 directive, a 2016 grid — each layer adds a reading, and each reading has a timestamp, a datum, and an uncertainty. The seabed itself has not changed much on human timescales. What has changed is the quality of the question we are allowed to ask about it.
A print on a wall-sized coast map is, in the end, a committed answer. We draw a contour at a specific depth; we draw a shoreline at a specific tide stage; we draw a park boundary where a 1988 Portuguese law said it should be. Every one of those choices discards information to render a visible map. The responsibility we accept as a studio is to document which information was discarded, and why.
Sagres is a good coast to learn this on because its chart record is long. Henrique's pilots were working the same water in the fifteenth century that EMODnet's grid interpolates today. The depths are not identical to what they measured, but the sea is. A chart is a cumulative sentence about a coast, and the only honest version of it is one where each clause names its source. The coast prints we draw of this stretch sit at /shop/, with every contour's provenance written on the back.
FAQ
Which public datasets did you consult for the Sagres bathymetry?
Four: the Instituto Hidrográfico's nautical chart products for the southwestern cape, the EMODnet Bathymetry Digital Terrain Model (2016 compilation and subsequent releases), the OpenStreetMap coastline under the ODbL licence via Overpass, and the Portuguese park-boundary file from Decreto-Lei 241/88. Each has a different purpose and a different licence. None is a complete chart on its own; a usable reading of this shelf requires reconciling at least two of them against each other.
Can I use these sources to draw my own map of this coast?
Mostly yes, with attention to licensing. EMODnet Bathymetry is available for reuse under its own terms, including commercial use with attribution. OpenStreetMap coastline is ODbL — share-alike applies. The Instituto Hidrográfico's higher-resolution products are commercial and not open; public chart extracts are fine for personal reference but not for redistribution. The 1988 park-boundary polygon is a public document, distributed in digital form by ICNF.
Why do depths disagree between sources on the same spot?
Because they were measured in different years, at different vertical datums, with different instruments, and gridded or contoured by different interpolation methods. A sounding from a 1960s single-beam transect, a modern multibeam cell, and a GEBCO-filled cell can all describe the same seabed and show different numbers. The disagreement is not error — it is the honest record of how depth is produced across six decades of national and European data policy.
Does the Costa Vicentina Natural Park cover the sea off Tonel?
In part. The 1988 protected-landscape designation and the 1995 Parque Natural upgrade both extend into the maritime zone along sections of the coast, including stretches of the southwestern turn around Sagres. The exact seaward extent varies along the park's length and is specified in the current management plan. For a chartmaker, the practical point is that the park's polygon crosses the coastline and claims part of the shelf.
What's the difference between a nautical chart and a bathymetric grid?
A nautical chart is a navigation product: it selects contours and spot depths for safety-of-life-at-sea decisions, generalises aggressively, and prioritises hazards. A bathymetric grid is a scientific product: it stores a depth value at every cell of a regular grid, keeps interpolation decisions visible, and documents its sources. A chart tells a captain where not to go. A grid tells a researcher what the seabed looks like.
Why does Henry the Navigator belong in an article about depth data?
Because the practice of recording what is under the sea off Sagres started with his pilots, even if their soundings were marginal annotations on portolan charts rather than drawn contours. Treating the water west of the headland as a measurable surface — rather than a blank west — is a cultural shift that begins at Sagres in the fifteenth century. Every modern dataset we overlay sits on top of that six-century habit of looking down and writing it down.
How accurate is the EMODnet grid at the Sagres shelf break?
Accuracy is higher on the shelf interior, where IH surveys contribute most of the underlying soundings, and lower on the slope where track spacing widens and interpolation does more of the work. EMODnet publishes a confidence layer alongside the depth grid; reading the two together is the honest way to use the dataset. For a studio print, we treat the shelf-interior contours as firm and the slope contours as indicative, and we say so on the back of the print.
New breaks and 10% off your first print.
One email now with your code. No noise after.