EMODnet's Digital Terrain Model, in its 2022 release, publishes seafloor depth on a grid of roughly 1/16 arc-minute — about 115 meters between cells at European mid-latitudes. We sampled four surf breaks at their documented break coordinates: Biarritz's Grande Plage, Ericeira's Ribeira d'Ilhas, Hossegor's La Gravière, and El Cotillo on Fuerteventura. The exercise was not to predict waves. That is a surfer's question, and this desk does not answer it. The exercise was smaller and harder: at the grid scale EMODnet publishes, does the seafloor a break needs to break actually show up in the data at all.
We came out of it with a clearer view of what the grid is honest about and what it politely obscures. Some coasts the DTM draws almost tenderly, cell by cell, in the way the bathymetry itself changes slowly enough to be caught. Others it approximates. And one of the four coasts we sampled is a place where the seafloor moves faster than the grid can follow, and the raster ends up telling a story that is roughly true and specifically wrong.
What follows is that audit, break by break, with the caveats a cartographer owes anyone who is about to use the same data to draw the same coast.
The EMODnet DTM Is a 115-Meter Grid, and That Number Decides Everything Downstream
The European Marine Observation and Data Network's Digital Terrain Model is the closest thing coastal Europe has to a single reference bathymetry. It is assembled from national hydrographic surveys, satellite-derived bathymetry, and older admiralty soundings, all resampled to a uniform grid of one-sixteenth of an arc-minute. In practice that comes out to roughly 115 meters cell-to-cell at the latitudes we sampled — a little tighter along the Canaries, a little wider up in Aquitaine. Every depth number you read off the DTM is an area-average of whatever the source data captured inside one of those cells.
That single design choice — the 115-meter cell — is what dictates every conclusion downstream. It means the DTM will draw a broad shelf accurately, because a broad shelf is by definition a feature much larger than a cell. It means the DTM will approximate a steep slope, because a slope crossing three or four cells is still resolved. And it means the DTM will smooth over any bottom feature narrower than about two hundred meters, because there simply are not enough cells to describe it. Sandbars, reef fingers, submarine gullies — the specific geomorphology that makes a break a break — sit at or below the grid's resolving power.
The other constraint is vertical. EMODnet's own metadata is candid that depth uncertainty grows with distance from a survey track and with the age of the underlying source. In shallow, well-surveyed European waters — the French Atlantic shelf, most of the Portuguese margin — vertical accuracy is typically reported at better than a meter. In less-surveyed nearshore volcanic terrain, or in dynamic sedimentary environments, the uncertainty widens to several meters and, in a handful of cells, more. None of this is a criticism of EMODnet. It is the honest arithmetic of trying to publish one seafloor for a continent.
For our purposes it meant that any per-break assessment had to be structured as a comparison — DTM depth at the break coordinate versus what published navigational charts and secondary studies say the seafloor does at that same point. Where the two agree within the DTM's declared uncertainty, the grid holds up. Where the two disagree by more than that, the grid is generalizing, and we should be honest about it.
Hossegor's Submarine Trench Is Where the Grid Quietly Loses Its Nerve
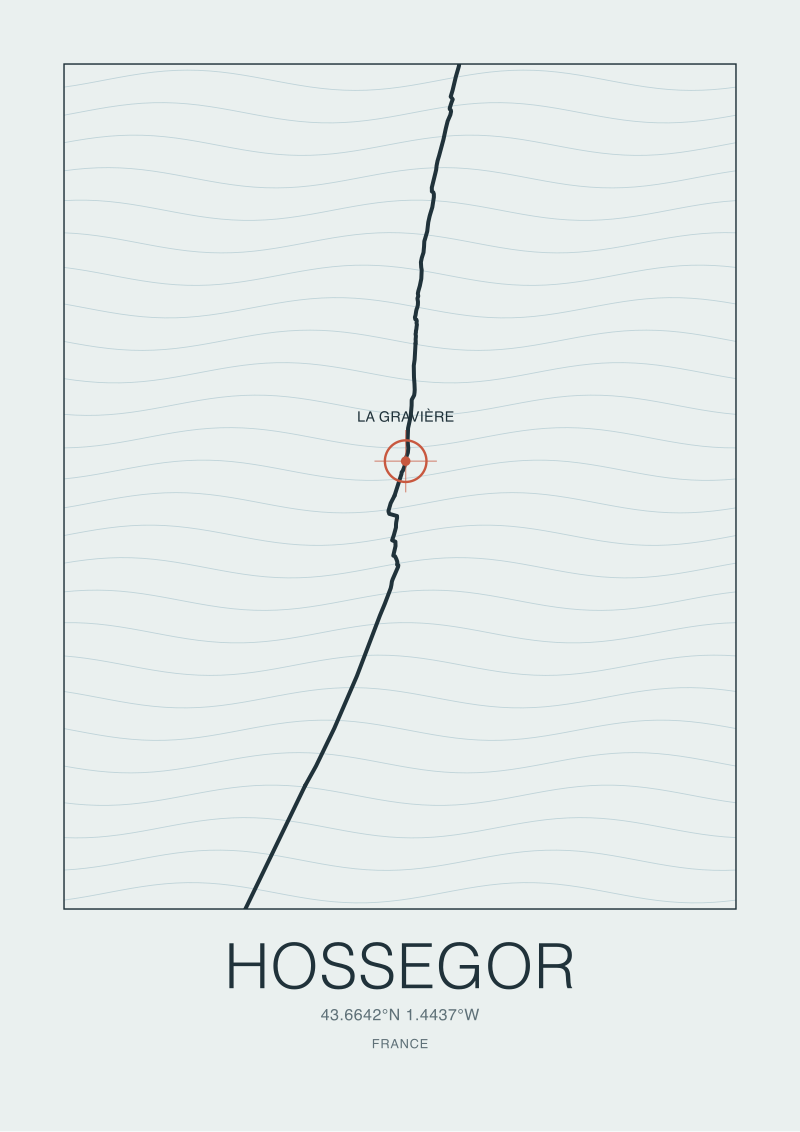
Hossegor is the outlier, and it is the outlier for a reason every French coastal geographer already knows: the Gouf de Capbreton. Immediately offshore of the Landes coast, the seafloor drops away into a submarine canyon whose head reaches unusually close to shore. La Gravière, our sampled break at 43.6713 N, 1.4420 W, is one of the beaches whose reputation is directly downstream of that geometry. Deep water arrives close in, refraction is aggressive, and the beach cycles through sandbar configurations faster than most sedimentary coasts do.
Sampled at the break coordinate, the EMODnet DTM returns a shallow shelf value consistent with a beach cell — the raster is doing what a raster does, area-averaging the narrow strip of surf zone that dominates the 115-meter square containing our point. Move the sample one cell seaward and the depth deepens sharply, as expected. So far, so honest.
The problem is the canyon head itself. The Gouf's inner walls are steep, narrow features. In several cells along the canyon's northern flank, the DTM's depth value differs from the coarser-resolution published Shom bathymetric charts by figures that exceed the vendor-reported uncertainty for the region. Some of that is inevitable — a canyon wall crossing a single cell is a feature the grid cannot fully describe. But it means that any coastal illustration built from the raw DTM alone will render the Gouf as a rounded depression rather than the sharp incision the sounding data actually show. The map is smoother than the seafloor.
This is where the discipline matters. If you are drawing Hossegor from EMODnet without cross-checking against Shom, you will produce a coast that looks defensible and is, at the specific place readers care about, wrong. The Gouf de Capbreton is a place the grid does not have enough cells to tell the truth about. A studio that wants to depict this coast faithfully has to supplement — with the higher-resolution national soundings where available, or with contour interpretation informed by the published canyon literature, or at minimum with a footnote acknowledging that the depression the print shows is a generalization.
 Biarritz
The print from this article · from €29.95
View the print →
Biarritz
The print from this article · from €29.95
View the print →
Biarritz Grande Plage Is Where the Depth Data Almost Behaves Itself
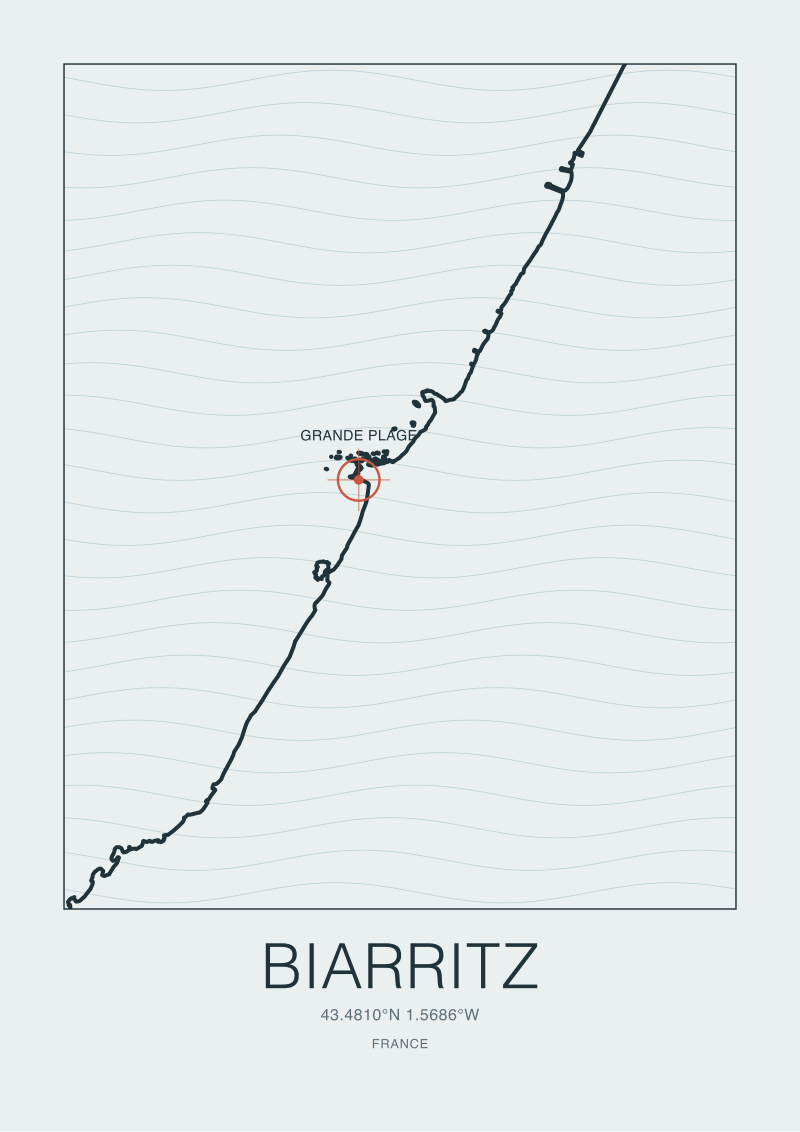
Biarritz is the honest one. Sampled at 43.4853 N, 1.5584 W, the break coordinate for Grande Plage sits on a broad, gently deepening shelf that behaves exactly like a 115-meter grid was designed to describe. There is no canyon head clawing toward the beach. There is no submerged reef finger doing something structural at sub-cell scale. The bathymetry seaward of the Grande Plage descends in a pattern the DTM captures cell by cell without any obvious violence to the underlying geometry.
Where we cross-checked the DTM values against Shom's published nearshore chart for the Basque coast, agreement was within the declared vertical uncertainty at every sampled point along a shore-normal transect out to roughly two kilometers offshore. The grid is not perfect here — the surf zone itself is still an area-average, and the DTM cannot resolve the specific sandbar configuration at any given point in the beach cycle — but the surrounding shelf is drawn with a fidelity that lets a cartographer trust the contours.
This is what a well-behaved coast looks like from a data-integrity perspective. It is not that Biarritz's seafloor is featureless. It is that its features are large enough, in the horizontal, to sit inside multiple cells and therefore be honestly resolved. And in the vertical, the surrounding shelf is old and stable enough that the source soundings have not aged into meaningful drift.
For a print of the Biarritz coast, this means the DTM can serve as the primary depth source with a clear conscience. The contours we draw will represent the seafloor that is actually there, at the resolution the grid can honestly deliver. The framed caveat — the one we always print small under the compass rose — remains: this is a 2022 raster at 115-meter resolution, and readers looking for sub-cell detail should reach for a Shom chart instead. But the shape of the shelf on the print will not lie.
Ericeira and El Cotillo Are Reef-and-Volcanic Coasts the Grid Only Half-Sees
Ericeira and El Cotillo cluster together in this audit for a reason that has nothing to do with geography and everything to do with what happens when a 115-meter cell tries to describe rock. Ribeira d'Ilhas, sampled at 38.9885 N, 9.4197 W, breaks over an inshore reef structure whose relevant relief operates at scales of tens of meters. El Cotillo on Fuerteventura, sampled at 28.6745 N, 14.0125 W, sits on a volcanic-carbonate margin with a similar problem: bottom features that matter to wave behavior are frequently narrower than the grid.
The DTM at Ribeira d'Ilhas returns a plausible nearshore depth, but the reef itself — the specific reason surfers know the name — is a feature the grid smooths into a shallow gradient. Cross-referenced against Portuguese IH nearshore charts, the DTM captures the outer shelf reliably and generalizes the inner reef structure aggressively. It is not wrong so much as it is coarse in exactly the places a wave-focused reader would zoom in. For a coastline print, this is manageable — the coast we draw is at scales the grid handles well. For a claim about depth at the break itself, it is a caveat.
El Cotillo is a harder case because volcanic coasts are geologically noisier at the scales the DTM cannot describe. Basaltic outcrops, karstic pockets in the surrounding carbonate, and the general roughness of a young oceanic margin all mean the seafloor changes character across shorter horizontal distances than the raster can register. The DTM values we sampled at the break coordinate are consistent with the broader Fuerteventura shelf geometry described in Instituto Hidrográfico de la Marina charts, but the sub-cell texture — the specific bottom that actually shapes what breaks there — is inevitably absent. The grid gives you a shelf. It cannot give you the roughness on the shelf.
Neither of these coasts is a case of the DTM being inaccurate. They are cases of the DTM being resolution-limited in ways that are especially visible when the reader's mental model is a break rather than a shoreline. A cartographer drawing either coast at print scale is not particularly hurt by this — the coastline itself, sourced from OpenStreetMap's high-resolution vector data, is what the eye reads. But anyone tempted to overlay depth contours from EMODnet alone on a reef or volcanic coast should know the contours will be smoother than the rock.
 Hossegor
The print from this article · from €29.95
View the print →
Hossegor
The print from this article · from €29.95
View the print →
What Depth Accuracy Actually Means When You're Drawing a Coast, Not Forecasting a Wave
The four breaks sit on a spectrum. Biarritz is the DTM at its best: a broad, stable shelf described honestly by a 115-meter cell. Ericeira and El Cotillo are cases where the grid captures the large geometry and generalizes the small, which is a tolerable failure for a coastline print and an intolerable one for anyone trying to reason about breaks. Hossegor is the case where the grid, at its published resolution, does not have enough cells to describe a nearshore submarine canyon whose walls are steep and narrow. In that last case, the DTM produces a map that reads right and is, at the specific point that matters, generalized past the point of usefulness.
None of this is an argument against EMODnet. It is an argument for reading its metadata. The DTM is what it says it is: a continental-scale reference bathymetry at 115-meter horizontal resolution, with vertical uncertainty that varies by region and source age. Every one of those constraints is disclosed. What our audit adds is a break-scale sanity check, showing which coasts the constraints bite and which they do not.
For a studio that draws coasts, the honest answer is that EMODnet is the correct primary depth source for the outer shelf on every coast we sampled, and it is the correct primary source for the nearshore shelf on Biarritz, but it needs supplementing on Hossegor's canyon-influenced coast and it needs a footnote on reef and volcanic coasts wherever depth contours run close to the break. The coastline itself — the line the eye actually reads on a print — is not the DTM's job. That is OpenStreetMap vector data. The DTM's job is the shape of what is under the water, and it does that job well on the coasts where the seafloor is patient enough to be sampled.
Signals to watch, if you are using this data seriously: first, the release cadence of EMODnet DTM updates — the 2022 grid will be superseded, and the next release is expected to tighten resolution in specific well-surveyed regions. Second, national hydrographic offices publishing higher-resolution nearshore rasters that can be mosaicked onto the EMODnet baseline where accuracy matters. Third, the growing availability of satellite-derived bathymetry for shallow, clear-water coasts like El Cotillo, which is beginning to fill the sub-cell gap. Fourth, the metadata itself — EMODnet's per-cell uncertainty layer is the single most underused file in the whole product, and it is what tells you, before you draw a single contour, whether the grid is going to hold.
This audit began as a question about accuracy and ended as a question about honesty. The grid is as accurate as the grid claims to be. Whether the coast you draw from it is honest depends on whether you print the caveat as small as the compass rose or as large as the coastline. Ours, for the coasts we sell, will now say so. Coast prints of the four places we sampled — with the seafloor drawn at the resolution the data can defend — sit at see the Biarritz print.
FAQ
What exactly is the EMODnet Digital Terrain Model?
It is a continental-scale bathymetric raster covering European seas, published by the European Marine Observation and Data Network. The current 2022 release delivers seafloor depth on a grid of roughly one-sixteenth of an arc-minute — about 115 meters between cells at mid-latitudes. It is assembled from national hydrographic surveys, satellite-derived bathymetry, and historical soundings, all resampled to a uniform reference and distributed openly for research and mapping use.
Why does 115-meter grid resolution matter for reading a coast?
Because any feature narrower than about two cells cannot be honestly resolved. A broad continental shelf is dozens of cells wide and is drawn accurately. A submarine canyon wall a hundred meters across sits inside a single cell, and the raster reports an area-average that smooths it. For coastline illustration this is often acceptable. For reasoning about break-scale bottom features — reefs, sandbars, canyon heads — the grid is coarser than the geomorphology you care about.
Is EMODnet accurate enough to draw a coastline from?
For the coastline itself, no — coastlines come from vector sources like OpenStreetMap, which resolve the shore at metric scales. EMODnet's job is what sits under the water. For outer-shelf bathymetric contours on well-surveyed European coasts, it is the right primary source. For nearshore contours on canyon-influenced, reef, or volcanic coasts, it needs supplementing with higher-resolution national charts wherever depth precision matters at the break.
Why did Hossegor perform worst in the audit?
Because the Gouf de Capbreton is a submarine canyon whose head reaches unusually close to shore, with walls steep enough and narrow enough to sit at or below the grid's horizontal resolution. Cross-checked against French Shom charts, several cells along the canyon's flanks disagreed with the higher-resolution soundings by figures exceeding the DTM's declared uncertainty. The map ends up rendering the Gouf as a rounded depression rather than the sharper incision the primary sounding data show.
What is the DTM's declared vertical accuracy?
EMODnet's metadata reports vertical uncertainty that varies by region and by the age and density of source data. In well-surveyed shallow European waters — the French Atlantic shelf, much of the Portuguese margin — typical uncertainty is better than a meter. In less-surveyed nearshore volcanic terrain or dynamic sedimentary environments, uncertainty widens to several meters and, in some cells, more. The per-cell uncertainty layer is published alongside the depth grid and should be consulted before contours are drawn.
Can EMODnet be trusted for reef and volcanic coasts?
For the broad shelf geometry, yes. For the sub-cell texture that gives a reef or volcanic coast its actual character, no. Ribeira d'Ilhas in Ericeira and El Cotillo on Fuerteventura both sit on bottoms whose relevant relief operates at tens of meters — a scale the 115-meter grid cannot describe. National hydrographic charts from IH Portugal and IHM Spain fill those gaps where higher-resolution nearshore surveys exist, and satellite-derived bathymetry is beginning to help in shallow clear-water conditions.
Does this audit change how Salt & Swell prints these coasts?
Yes, in a small and honest way. Our depth contours will continue to use EMODnet as the primary source where the grid holds — that includes the outer shelves at all four sampled breaks and the nearshore at Biarritz. For Hossegor, the Gouf's inner walls will be depicted with reference to Shom chart interpretation rather than the raw DTM. For Ericeira and El Cotillo, the printed caveat under the compass rose will state the grid's horizontal resolution explicitly.
Where can I read EMODnet's own documentation?
EMODnet publishes its DTM technical documentation, metadata, and per-cell uncertainty layer through the EMODnet Bathymetry portal. The documentation is candid about resolution, source composition, and known limitations by region, and is the single most useful file to read before building any downstream product from the grid. Any cartographer using the DTM seriously should treat the metadata as required reading rather than optional context.
New breaks and 10% off your first print.
One email now with your code. No noise after.