There is a pattern we see every time someone asks us how we drew the shoreline for a Biarritz print, or an Ericeira print, or a Hossegor one. The assumption is that a coastline was traced from a single, definitive map, held somewhere by a national agency, correct to the metre. It wasn't. There is no single definitive map. What changed in 2026 is not the coast itself but who is now doing the drawing, and on what data — and once you know that, you cannot look at a shoreline the same way again. This is a piece about the four patterns that decide what any coastline map is actually telling you, and what a reader who cares about coasts should watch for from here.
The Tide Problem
Every coastline you have ever seen printed was drawn at a tide. That sentence sounds small until you sit with it.
A shoreline is not a line. It is a boundary that moves — twice a day, more at spring tides, less at neaps, and the physical distance between low water and high water at Grande Plage in Biarritz, or along the sand shelves off La Gravière in Hossegor, is not trivial. Different national agencies have historically drawn "the coast" at different tidal datums: mean high water in the British tradition, mean sea level in parts of continental Europe, mean lower low water in the American Great Lakes convention. Pick two maps of the same beach drawn to two datums and lay them over each other, and you will find a strip of sand that belongs to one map and not the other. Neither is wrong.
OpenStreetMap, which is the substrate almost every independent cartographer now works from — including ours, and the source we credit for Biarritz, Ericeira, Fuerteventura and Hossegor in our own data — uses `natural=coastline` as the convention for mean high water. This means the shoreline you see on an OSM-derived map is, effectively, the wet line at high tide. If you walked the beach at El Cotillo in Fuerteventura at low tide with the OSM map in hand, you would find yourself standing on rock and sand that the map does not depict as land. The map is not lying. It is answering a different question than the one you are asking.
The Coastline Paradox
The second pattern is older, and famous enough that it has a name. It is called the coastline paradox, and it says something uncomfortable: a coastline does not have a single length.
Measure the perimeter of the Fuerteventura shoreline with a ruler calibrated to kilometres, ignoring bays smaller than a kilometre, and you get one number. Measure it with a ruler calibrated to a hundred metres, catching every cove above that scale, and you get a bigger number. Measure it with a ruler calibrated to a single metre, catching every rock and inlet, and you get a bigger number still. The finer the measurement, the longer the coast — and the sequence does not converge on a stable answer. Benoît Mandelbrot used this observation in the 1960s to argue that coastlines are, mathematically, fractal in behaviour. The practical consequence is that every published length figure for a coast is a statement about a resolution, not a statement about a coast.
This is why the answer to "how long is the Portuguese coast" depends less on Portugal and more on the map you were given. Ericeira's stretch of headland, viewed from a satellite image sharpened to a metre per pixel, has vastly more perimeter than the same headland at the ten-metre resolution most trade atlases use. Neither figure is the truth. Both are consequences of a decision made before anyone started measuring.
A coastline is not a length. It is an argument about what counts as detail.
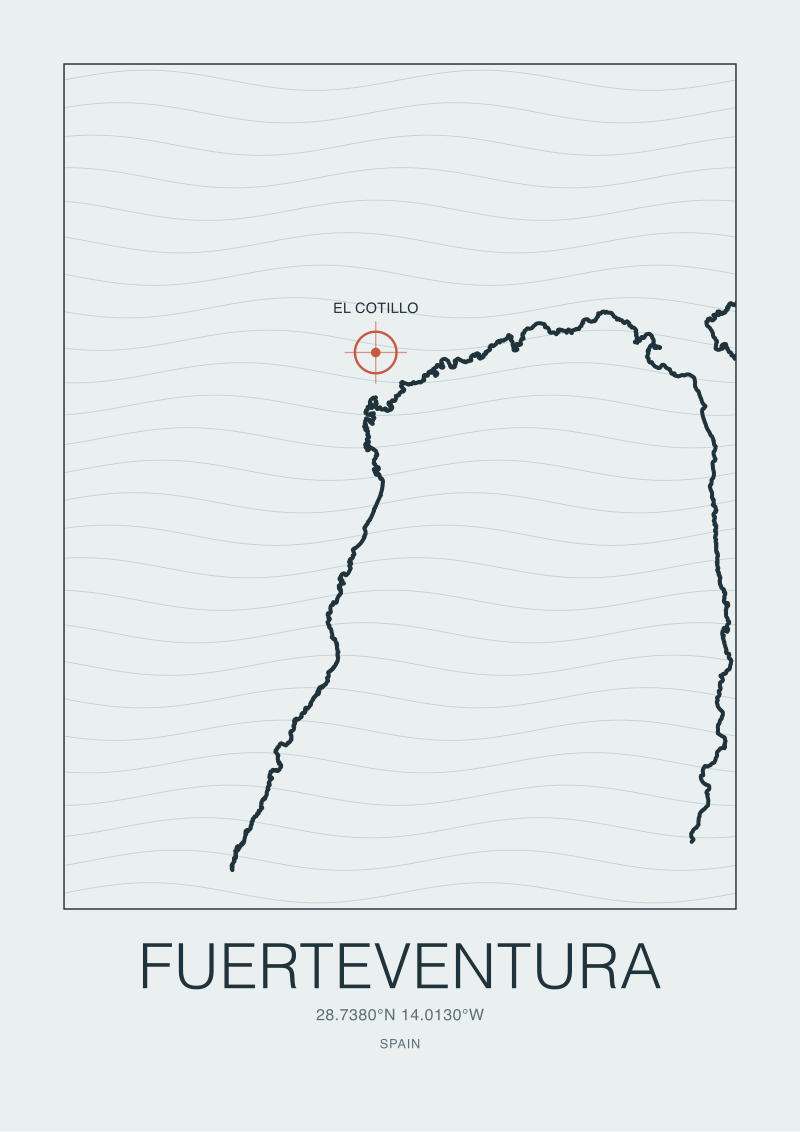 Fuerteventura
The print from this article · from €29.95
View the print →
Fuerteventura
The print from this article · from €29.95
View the print →
The OpenStreetMap Turn
This is the change that actually landed in the last two years, and it is the part most readers underestimate.
For most of the twentieth century, if you wanted the authoritative shape of a coast, you consulted a national hydrographic office: the SHOM in France, the Instituto Hidrográfico in Portugal, the Instituto Hidrográfico de la Marina in Spain, the UK Hydrographic Office in Britain. Their charts were rigorous, expensive, licensed, and slow to update. They were also, for a very long time, the only game in town. Independent studios drawing coastlines — for prints, for editorial illustration, for regional atlases — either paid the licensing fee, redrew from paper source, or accepted that they were working from something second-hand.
The pattern of the last several years, accelerating sharply through 2025 and 2026, is that OpenStreetMap's `natural=coastline` — pulled through the Overpass API under the ODbL open licence — has quietly become the working substrate for almost every non-institutional cartographer. Our own studio uses it as the source for every coast we draw, including the four in this piece. It is the reason a small print studio can produce a rigorously sourced map of Biarritz, Ericeira, Fuerteventura and Hossegor without a licensing budget, and cite the provenance line for each of them.
The turn matters because it shifts the answer to a very old question. Ten years ago, if you asked "where does this coastline come from," the honest answer was usually "we traced it from a national chart, please do not sue us." Today the honest answer is a source URL and a licence name. That is a small revolution in what independent coastal cartography can claim.
The Smoothing Choice
The final pattern is the one cartographers argue about most and readers see least. Every rendered coastline you have ever looked at has been generalised — which is the polite word for smoothed.
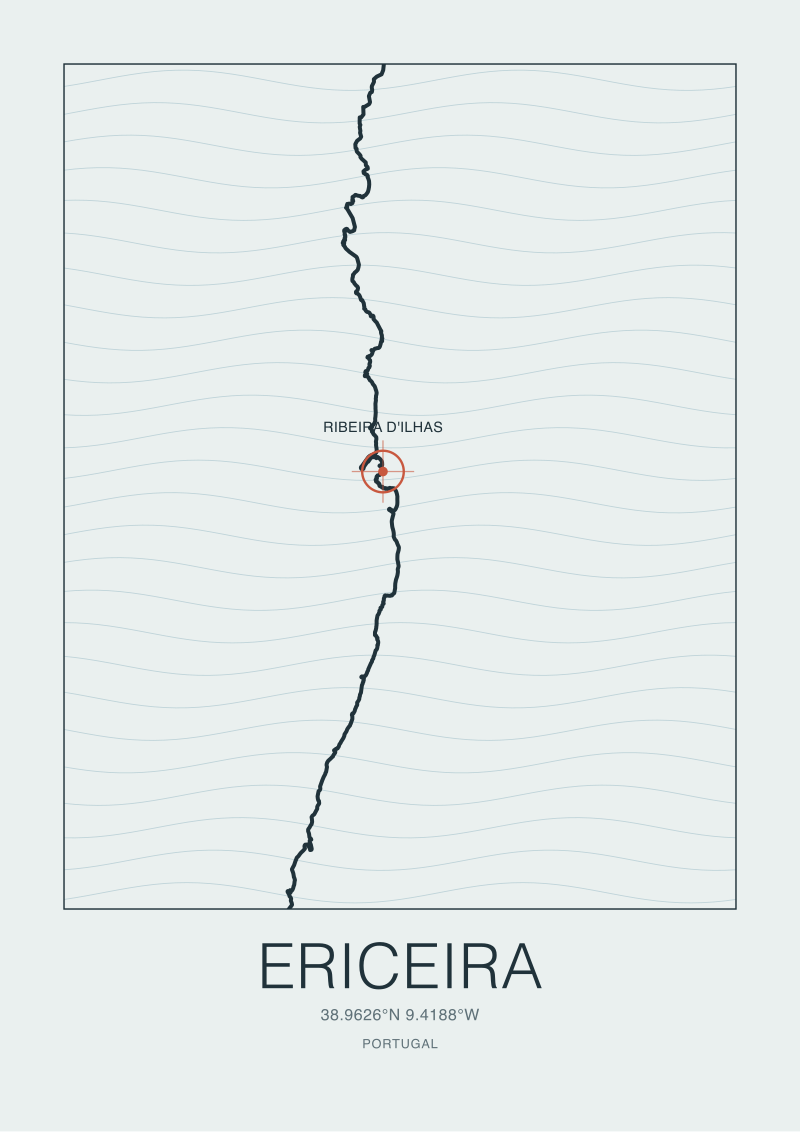
A raw OSM coastline for the Basque headland around Biarritz, or the granite indentations at Ribeira d'Ilhas, contains an enormous number of vertices. A vertex every few metres, sometimes more. If you plotted every one of them onto a paper map at print scale, the ink would blur into a thick, illegible line. So cartographers apply a simplification algorithm — Douglas-Peucker is the classic, Visvalingam-Whyatt is the more visually pleasing modern alternative — that keeps the vertices which matter to the shape and drops the ones that do not. What "matter" means is a taste decision. How aggressively you smooth is a taste decision. Whether you preserve small coves or let them vanish into the general run of the coast is a taste decision.
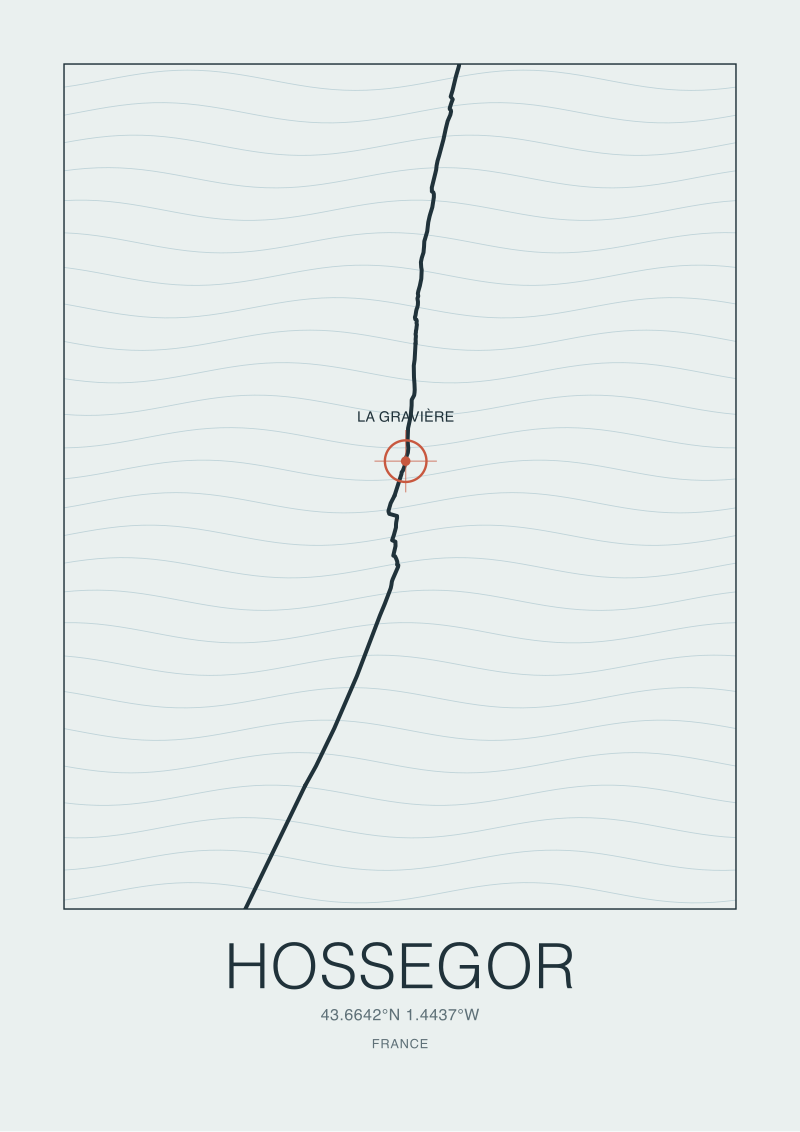
This is where cartographer bias lives. Two studios starting from identical OSM data for Hossegor, applying different simplification thresholds, will publish coastlines that disagree in ways a reader will notice without being able to name. One will look softer, more continuous, more graphic. The other will look bristly, more accurate, less printable. Neither has misrepresented the coast. Both have made an editorial choice, and both should — in an ideal world — say so.
We say so on every print in our /shop/ catalogue. It is the smallest possible form of showing your working.
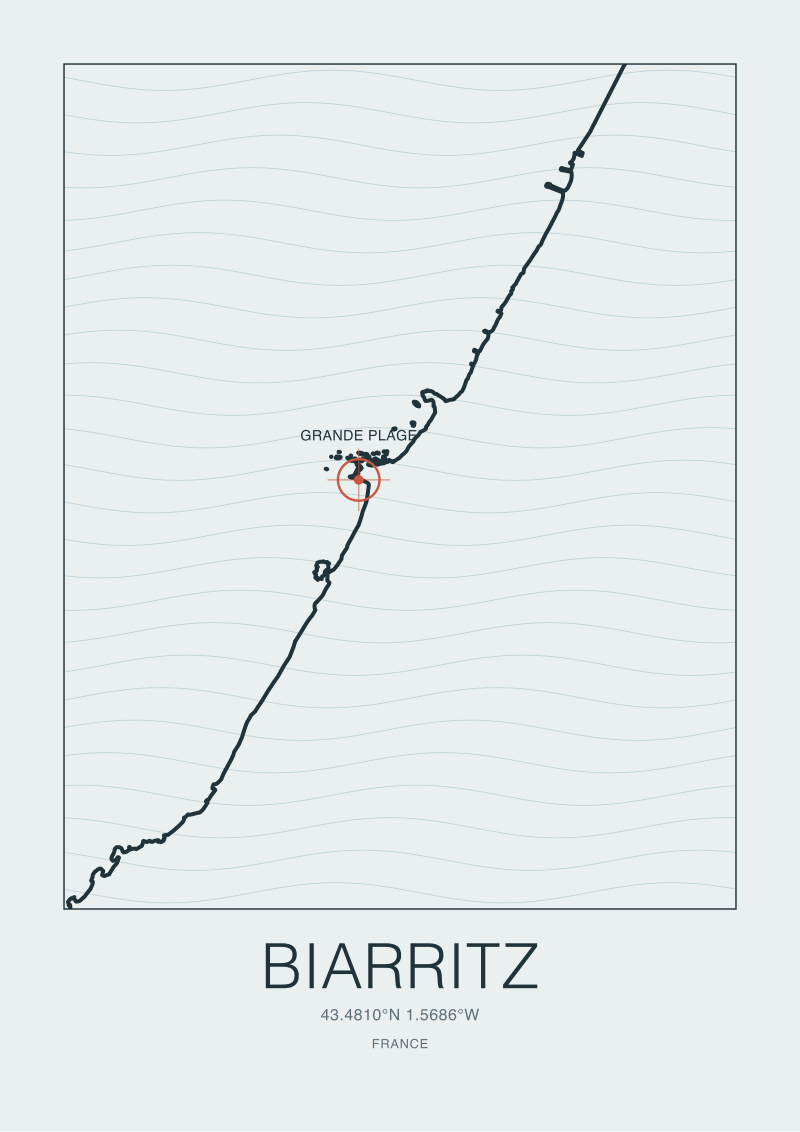 Biarritz
The print from this article · from €29.95
View the print →
Biarritz
The print from this article · from €29.95
View the print →
So What Do You Actually Do
If you care about coasts, and specifically about coastlines as drawn objects rather than as forecasts of surf on any given weekend, three habits will change how you read every map from here.
The first habit is to ask what tide the map is drawn at, because you now know that "the coast" is a boundary chosen from among several. If the source is OSM, you are looking at mean high water. If the source is a nautical chart, you are almost certainly looking at mean lower low water, which is a different line entirely. The second habit is to ask what resolution the shoreline was captured at — a coast is not a length, so any number attached to a coast is a claim about a scale. The third habit is to look for the provenance line: source, licence, simplification method. Any coastline map worth trusting will tell you those three things without you having to ask.
Watch, from here, for four signals that will tell you whether coastal cartography keeps opening up or slides back into institutional gatekeeping. Watch whether more independent studios begin publishing the source and licence line on their prints, the way ours does. Watch whether OpenStreetMap's coastline layer holds its ODbL licence terms unchanged, because a licence tightening would compress the entire independent map economy overnight. Watch whether national hydrographic agencies begin releasing their own datasets under open licences, catching up to what OSM has already normalised. And watch whether the studios you follow start naming their simplification method — Douglas-Peucker, Visvalingam-Whyatt, custom — because that is the moment the last hidden decision in coastal cartography becomes a stated one. The coast will keep moving. What we are watching is whether the honesty about drawing it moves too.
FAQ
What does "natural=coastline" actually mean on an OpenStreetMap-derived map?
It is the OSM tag used to mark the mean high water line — the wet edge of the sea at typical high tide. When a studio credits OSM as the coastline source, that is the line you are seeing. It is not the low-tide edge, not the storm-surge edge, and not the sand-berm edge. If you walk a beach at low tide, you will find yourself on ground the map does not depict as land, and that is a datum choice, not an error in the data.
Why do two different maps of the same coast disagree about its length?
Because a coastline does not have a single length. This is the coastline paradox: the finer the measurement scale, the more coves, rocks and indentations you catch, and the longer the perimeter becomes. There is no resolution at which the number stabilises. Any published figure for the length of a coast is really a statement about the measurement scale used, not about the coast itself. When two atlases disagree, they are usually working at different resolutions.
Where does a small print studio get its coastline data in 2026?
Almost always from OpenStreetMap's coastline layer, pulled through the Overpass API and used under the Open Database Licence (ODbL). This is a shift from a decade ago, when independent cartographers had to license from national hydrographic agencies or trace from paper charts. Our own Biarritz, Ericeira, Fuerteventura and Hossegor prints all cite OSM natural=coastline via Overpass as their source line.
What is the difference between Douglas-Peucker and Visvalingam-Whyatt?
Both are line simplification algorithms — they decide which vertices along a raw coastline to keep and which to drop when rendering at a smaller scale. Douglas-Peucker preserves vertices whose removal would displace the line beyond a chosen tolerance and is the classical default. Visvalingam-Whyatt ranks vertices by the visual area they contribute and tends to produce smoother, more graphically pleasing curves. The choice between them is a taste decision cartographers rarely disclose.
Are coastlines mapped by satellite now, and does that make them more accurate?
Satellite imagery is one input among several, and its resolution is a limit rather than a solution. Sub-metre commercial satellites can now resolve a coast at very high fidelity, but the tide problem still applies — a satellite image is a snapshot at whatever tide state existed when the pass occurred — and simplification is still required for print. Satellites made higher-resolution mapping cheaper and more consistent. They did not resolve the paradox.
Why do you cite OpenStreetMap for a Fuerteventura print instead of a Spanish national source?
Because OSM's coastline data for Fuerteventura is accurate, current, openly licensed, and — critically — verifiable. Anyone can query the same Overpass extract we used and check our work. Spanish national sources are authoritative but licensed, which makes provenance harder to publish. Our editorial preference is for sources a reader can independently inspect. That preference is why the OSM turn matters for independent cartography.
Does a coastline map need to name its tidal datum and simplification method to be trustworthy?
Not legally, but editorially yes. Those two pieces of information — which tide the coast is drawn at, and how the raw vertex data was simplified for print — are the two hidden decisions that shape every rendered coastline. A map that names them is telling you what it is; a map that hides them is asking you to trust it without showing its working. We think naming them should become the norm, and the signal to watch is whether it does.
New breaks and 10% off your first print.
One email now with your code. No noise after.